Axional Analytics
Every day, organizations create huge amounts of data related to their operations, but they find the amount of actual information is surprisingly small. Axional Analytics is designed to convert data into usable information via data aggregation, providing users with the information they need to make effective decisions about an organization’s strategic direction.
The Axional Analytics Suite comprises two tools: a data warehouse management tool and a OLAP analytical tool for end users. With this powerful combination, Axional Analytics can handle vast amounts of data originating from multiple sources, providing managers with big-picture insight to make more timely decisions.
With a data warehouse, your organization will be able to answer “who” and “what” questions. The OLAP module takes the next step by also answering “what if” and “why” questions, thus improving decision-making on future actions, which is typically more complex than simple data gathering.
Aplique Business Intelligence sobre los datos de su empresa
ETL Process
End users love Business Intelligence tools. They provide graphs, moving targets, drill-down, and drill-across. But much of the work in an analytical environment involves getting the data from operating systems into the data warehouse so that business intelligence tools can display those beautifully designed views.
The ETL module is a scalable enterprise data integration platform with exceptional extract, transform, and load (ETL) capabilities. The module is based on a Data Transformation Engine, and operates at a higher level of abstraction than many visual development tools. Generally speaking, developers can accomplish much more in far fewer statements than they can with 3GLs, because this engine is:
- Simple to program: Based on XSQL scripting language, allowing straightforward definition of complex ETL processes.
- Powerful: Extensive set of built-in functions. More than 300 pre-built functions and connectors to multiple databases and file formats, allowing definition of complex control flow, data flow, event-driven logic, and logging.
This module consolidates data from multiple source systems with different data organizations or formats. It has been specifically designed to move high volumes of data and apply complex business rules, bringing data together in a standardized and homogeneous environment. The key features of this tool are:
- Readers/writers with access to most data sources.
- Consolidation of data sources into a central data warehouse or data mart.
- Qualitative and quantitative metrics for work optimization.
- Unicode support, meaning that all international character sets are enabled; no matter where work is done, it can be collected and stored around the globe.
- User-definable functions that will be executed during the ETL process.
- Change data capture (CDC). Identify and capture data that has been added to, modified, or updated.
The XSQL language allows the definition of complex rules to transform raw data. Some examples are:
- Data validation. Includes cross-validation between several columns.
- Encoding free-form values (e.g., mapping texts to codes).
- Deriving a new calculated value.
- Anonymizing values for data privacy requirements.
- Transposing columns and rows.
- Aggregation functions.
Data is finally loaded into the target destination, usually a data warehouse or data mart. Updates may occur by replacing the previous data, updating existing data, or adding cumulative information.
This tool provides connectors for extraction from multiple data sources, from plain text to databases, Excel, XML, and others.
The data source is extracted by means of data streaming and can be loaded on the fly to the destination database with no intermediate data storage needed. Due to advanced loading functions, in most cases all ETL phases can be integrated in a single process, increasing security and reliability.
An intrinsic part of extraction involves the parsing of extracted data. As a result, the system checks if the data meets expected patterns or structures. If not, the data may be rejected entirely or in part.
- Relational Data Sources: JDBC/ODBC database connectors including IBM Informix, IBM DB2, Oracle, SQL Server, MySQL or Postgres. XML-defined queries support the definition of relationships and multi-table data retrieval.
- Non-Relational Data Sources: Direct Excel retrieval supports multi-sheet ranges and named ranges. Multilingual encoded text, with native loaders for CSV, Fixed Width, or RegEx when advanced text extraction is required. XQuery/XPath support for XML extraction.
- Auxiliary Data Sources: Create in-memory data sources for small data sets such as a code table or translated properties. This method safely holds and transmits encrypted data.
- Extract file attributes from a file system in a folder to be processed as regular records.
- Access to data — including XML and text — over HTTP/HTTPS, TCP, and FTP/FTPS.
- Various decompression methods for compressed source files: zip, compress, gzip, b2zip, etc. Methods for extracting data from files and manipulating files and directories.
The transformation stage applies a series of rules or functions to the source’s extracted data, deriving the end data to be loaded into the target database. This tool provides the ability to:
- Check data against hundreds or even thousands of business rules without performance limitations.
- Functions to log errors, reject records, and execute control flow.
- Rich set of functions for data transformation, which makes the following possible:
- Translation of coded values (e.g., if the source system stores 1 for on and 2 for off, but the warehouse stores O for on and F for off).
- Derivation of a new calculated value (e.g., sale_amount = qty * unit_price – discount_value).
- Lookup and validation of relevant data from tables or reference files in order to gradually change dimensions.
- Anonymization, supporting MD5 and Whirlpool hashing algorithms.
- Simple or complex data validation. If validation fails, a rejection of the data (full or partial) may or may not result.
- Generating surrogate key values.
Load and anonymize data all in one step: Anonymization and normalization is performed during the loading of external data from files. For each line of the source file, the following steps are executed:
- Read line in memory.
- Execute filtering operations in memory, allowing anonymization and normalization. The use of locally-defined functions as filters allows for custom anonymization procedures.
- Load resulting data into the table.
The loading phase stores the data in the destination, usually a data warehouse or staging area.
Inserting new records or updating existing ones can be done by searching the primary key columns. If the data loaded contains a PK of an existing record, then the record is updated; if the PK is new, then the record is inserted. To optimize performance, two different updating algorithms can be defined depending on the data type. For fact tables, at first an insertion is attempted and, if a PK exists, then the update is performed. For master tables, the first operation attempted is the update; if no records are updated, then an insertion is performed.
The system is equipped to handle past data as well. In this case, a history of all changes to records is kept, allowing any previous report to be reproduced.
Destination systems could include a database connected via JDBC, a file, or even streamed data seeded by posting to HTTP, FTP, or TCP.
Integration with Informix IWA: After loading data in target Informix databases, the ETL process can automatically call the process to update data from the Warehouse Accelerator Data Mart.
This tool supports massive parallel processing (MPP) for large data volumes. Companies should consider that simplicity is a fundamental part of performance, and the one-step “extract, apply transformation functions, and load” method is the fastest algorithm for ETL procedures.
In our test systems, a file with one million records can be extracted, anonymized with whirlpool methods, normalized, and loaded into database tables in under eight minutes, without using parallelization.
Axional OLAP Engine
The purpose of the OLAP Engine is to respond to queries from cube end users. These OLAP queries are performed on the server side using Java interfaces, and to increase performance, the Axional OLAP Engine may run on specially-configured server computers.
The architecture of the Axional OLAP engine includes the following features:
- Minimization of the amount of data movement between RDBMS and client app by:
- Storing (temp tables, derived tables) intermediate query results from multipass SQL and linking them in RDBMS.
- Pushing all calculations to RDBMS.
- Pushing all filtering and grouping to RDBMS.
- Pushing all filtering and grouping of calculations to RDBMS.
- Optimize SQL based on RDBMS type.
- Support multipass SQL. This is required to handle analytical questions that cannot be answered in a single pass of SQL.
- Handle normalized and denormalized data models efficiently.
- Automatically resolve typical start/Snowflake query errors and conflicts.
The Axional OLAP module uses a multidimensional view of aggregate data, granting quick access to strategic information for further analysis. Users can gain insight into their data through quick, consistent, interactive access to a wide variety of ways to visualize information. Everyone in the organization will be able to see the corporate data warehouse from their particular point of view.
This module also provides users with the information they need to make effective decisions about an organization’s strategic direction. Its features range from basic navigation and browsing to complex calculations and more serious analyses, such as time series. As decision-makers gain experience with OLAP capabilities, they move from mere data access to information to true knowledge.
The tool’s goal is to convert your business data into business intelligence. To achieve this objective, it leverages a preset data mart structure that simultaneously offers flexible configuration.
The Axional OLAP module insulates users from complex query syntax, model designs and elaborate SQL joins. Its multidimensional view of data provides a foundation for analytical processing through flexible information access. Users are able to analyze data across any dimension, at different levels of aggregation, with equal functionality and ease.
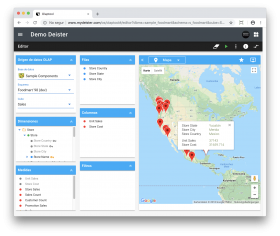
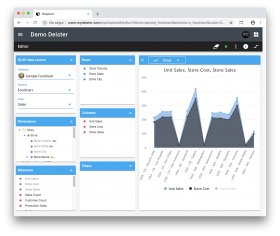
The OLAP module works with facts, and facts can be broken down into numbers. A fact could be a sales count, a sum of sales amounts, or an average. Within the OLAP module, facts are known as Measures and are organized into Dimensions, which are ways the facts can be broken down. For instance, the measure ‘total sales’ might be broken down by the dimensions ‘geographical area’ or ‘time’. Dimensions also have hierarchies of levels.
The set of dimensions and measures is called a Cube. The cubes facilitate multifaceted data analysis in response to complex business queries. Because they can be made up of more than three dimensions (hypercube), in-depth analysis is supported, allowing users to gain comprehensive and valuable business insights.
Axional Analytics allows for virtually unlimited numbers of dimensions to be added to the data structure (OLAP cube), allowing for detailed data analysis. Analysts can view data sets from different angles or pivots.
Our relational database directly stores the information contained in the various cubes (OLAP model). This approach translates native OLAP queries into the appropriate SQL statements. Thanks to the use of high-performance database tools, such as Informix IWA, this approach performs as well as a MOLAP database.
This approach also enables easy implementation of in-memory analytics, allowing for faster analysis and minimal IT involvement. In-memory analytics eliminate the need to store pre-calculated data in the form of OLAP cubes or aggregate tables. It offers business users rapid insights, with access to analysis of large data set and minimal data management requirements.
With the ETL process, several cubes can be created, each with a specific set of dimensions and measures more fitted to the requirements of a particular group of users. With cubes, managers gain insight into data through fast, accurate, and flexible methods to various views of business metrics that have been transformed from raw data into meaningful information.
Axional Analytics and IBM IWA
In the analytical world, queries can be a time-consuming drain on productivity as users wait for answers. As organizations amass more and more data, even basic queries can cause substantial delays. That’s why Axional Analytics is fully integrated with IBM Warehouse Accelerator (aka IWA), the first columnar in-memory database that can scan massive amounts of data in seconds.
Informix Warehouse Accelerator is a perfect system to implement data warehouses. It provides extreme performance while removing most of the fine-tuning required for traditional data warehouse systems.
The IBM accelerator offers these outstanding key features:
- Acceleration without manual tuning for each workload. No index to create or reorganize, no statistics to collect, no partitioning, no tuning, no storage management.
- Summary tables or materialized views are not needed; users can use fact tables directly.
- Billions of rows scanned in seconds. The deep columnar data representation and query processing on compressed data avoids the need for tuning.
- Linear performance. Query performance depends on data volume, not on query complexity.
Axional Analytics also provides some key features to improve integration with IWA:
- Automatic snapshot of updated ETL data to Warehouse Accelerator
- SQL statement optimization to ensure IWA compatibility
- Warnings about queries with tables or columns missing from data mart
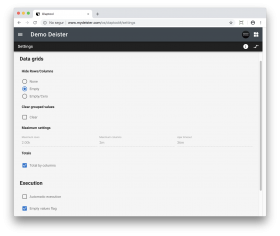
Client tools
Our two different OLAP clients provide an easy-to-use interface that will automatically retrieve and format data based on existing model definitions, for every user query:
- Grouping
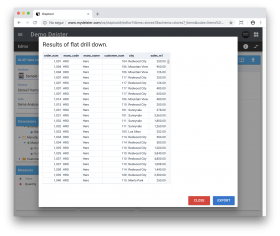
- Drill down: Focus on more detailed levels of the cube
- Drill up: Aggregate details to a more summarized level
- Sort, enter, and view data dynamically
- View graphics and visualizations
- Export data to Excel
- Perform advanced sorting and filtering
Empower your business today
Our team is ready to offer you the best services