Axional OLAP
Axional OLAP
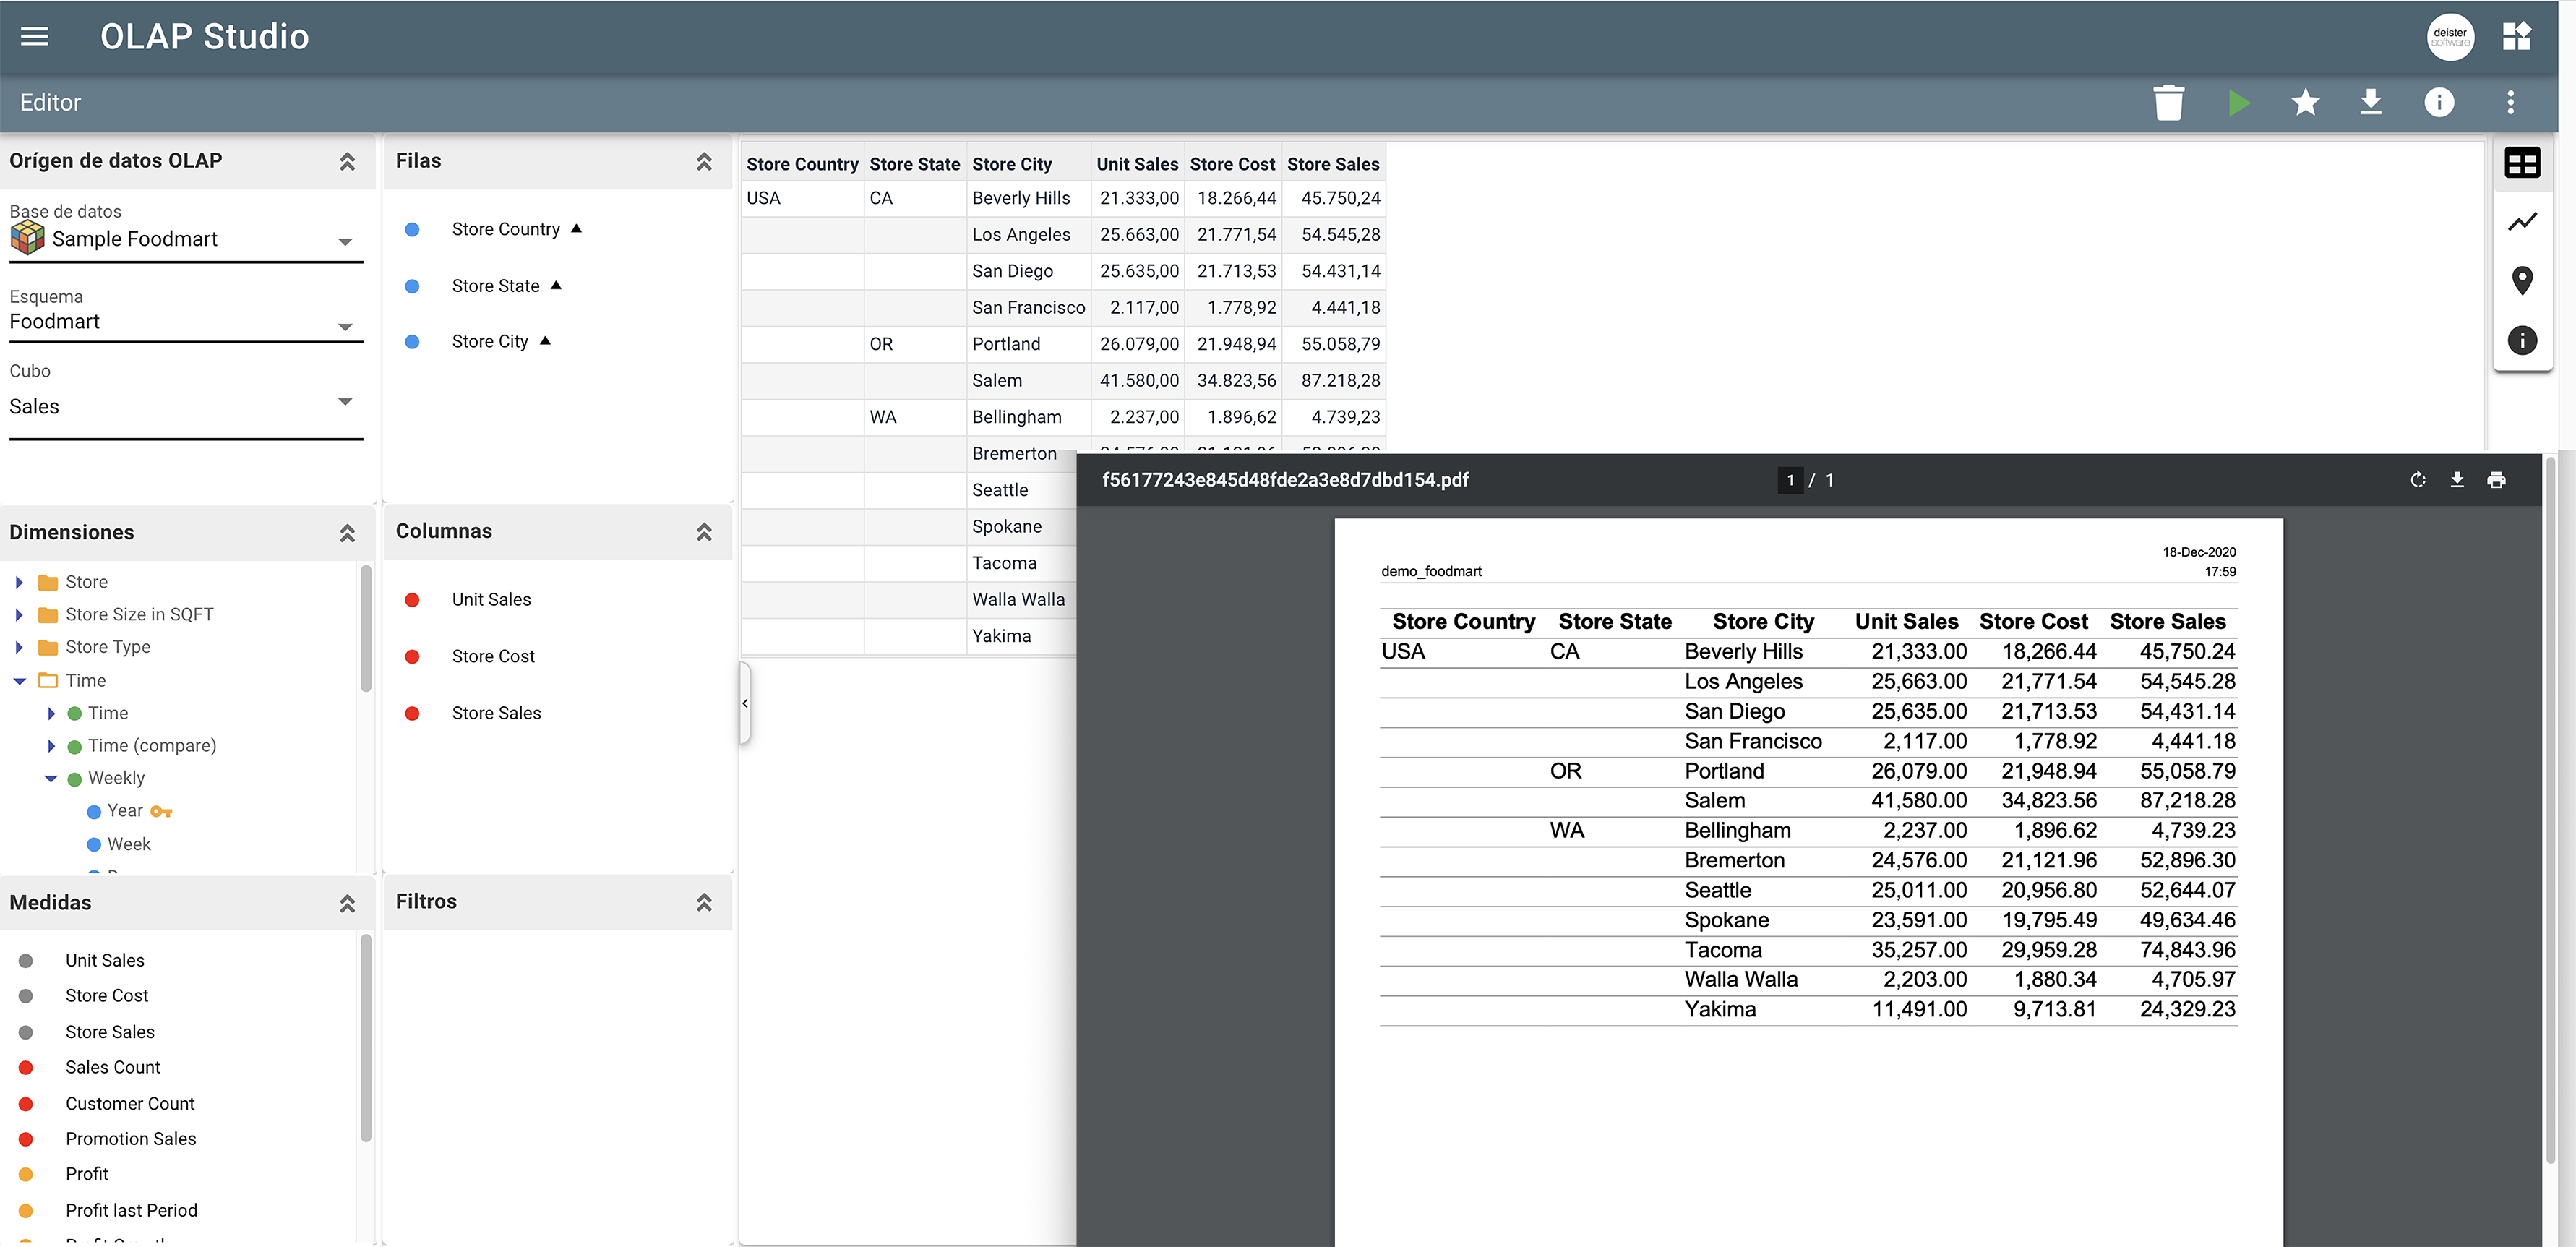
The Axional OLAP desktop tool provides a simple, accessible graphic user interface that will automatically retrieve and format data based on existing model definitions (OLAP cubes), based on XMLA connections.
This web-based OLAP client gives users the ability to define spreadsheets’ dimensions and measures, subsequently manipulating information to test different scenarios and resolve pressing business questions. Consolidated data, both detailed and big-picture, can be reviewed and analyzed within seconds. Using multi-select lists and drag-and-drop to customize the data displayed in interactive charts, Axional OLAP provides users a highly intuitive way to interact with cubes.
Analytical tools
The OLAP client allows users to quickly analyze multidimensional data in a flattened, two-dimensional grid format or in specific graphs or maps, thus quickly finding hidden issues, opportunities, and trends. The OLAP client includes a full set of cube manipulation features:
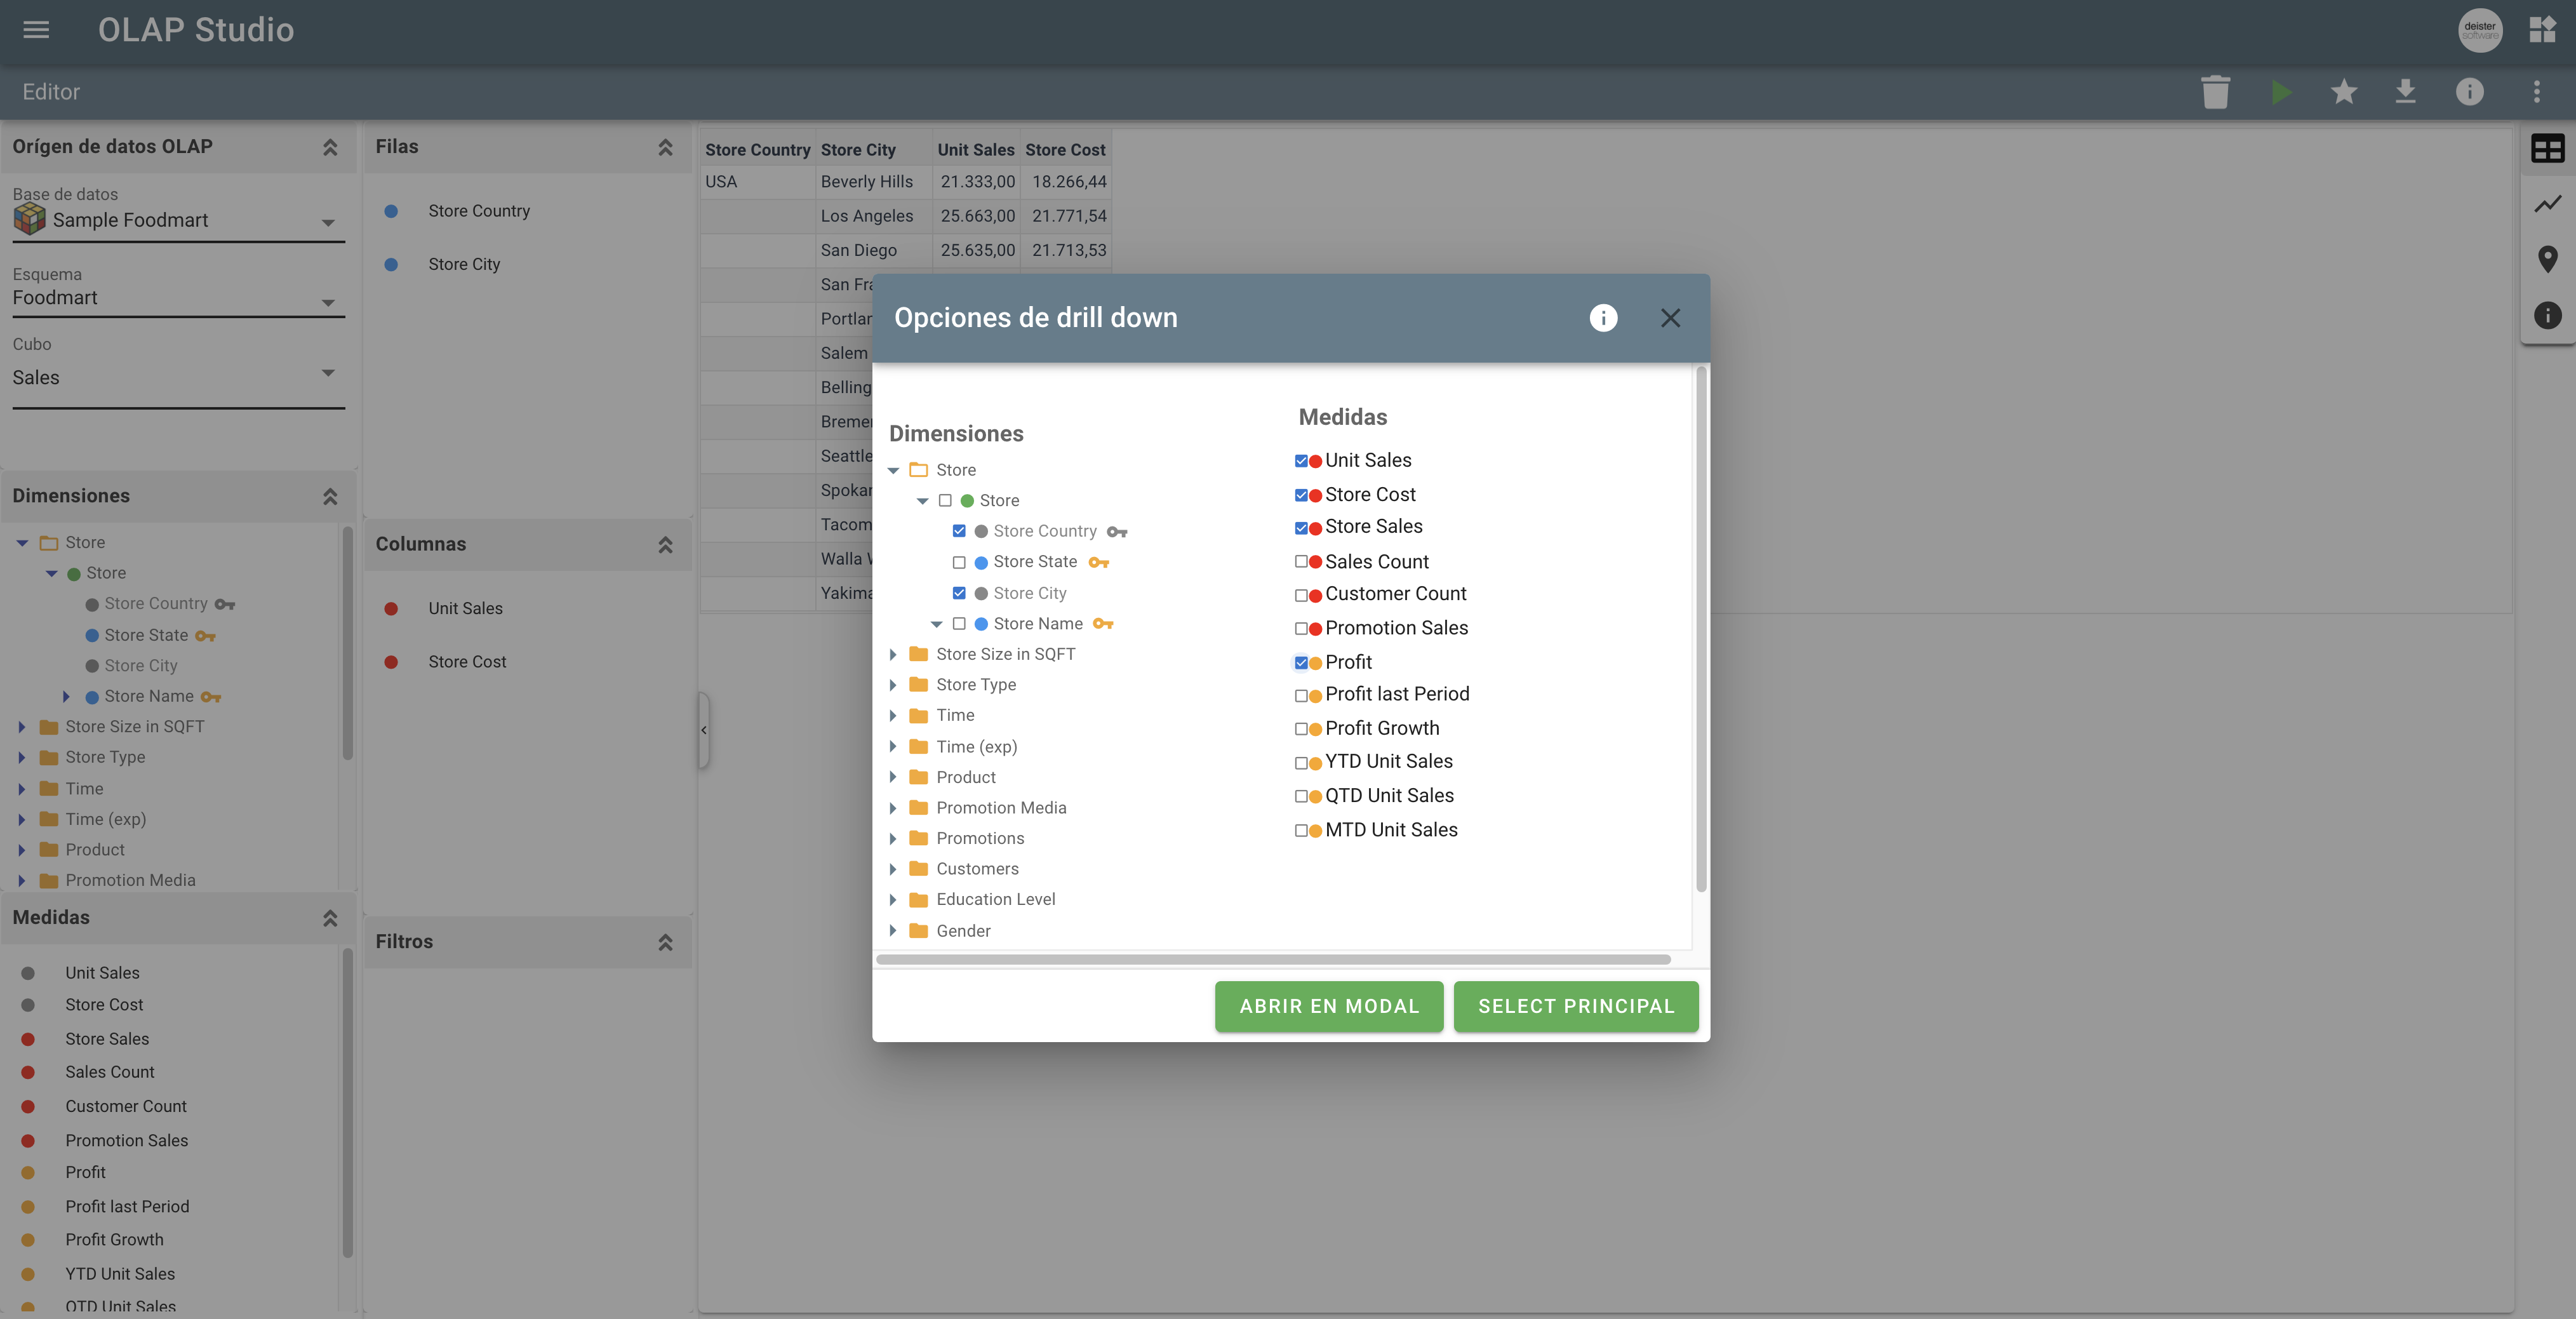
The drill down operation summarizes data to lower levels of a dimension hierarchy. It functions as a kind of ‘zoom’ on the details of a certain part of the cube. The OLAP cube knows the dimension’s position in the hierarchy, so when the analyst issues a command to drill down, the cube can present the next level of data. For example, “Product” can be explored in more detail by drilling down to product category.
This function rotates the data axis, providing a different perspective to view data. The user can simply swap the rows and columns with a single click, or perform a more complex operation by moving one of the row dimensions into a column dimension. If required, the system will group data with different dimensions.
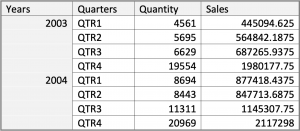
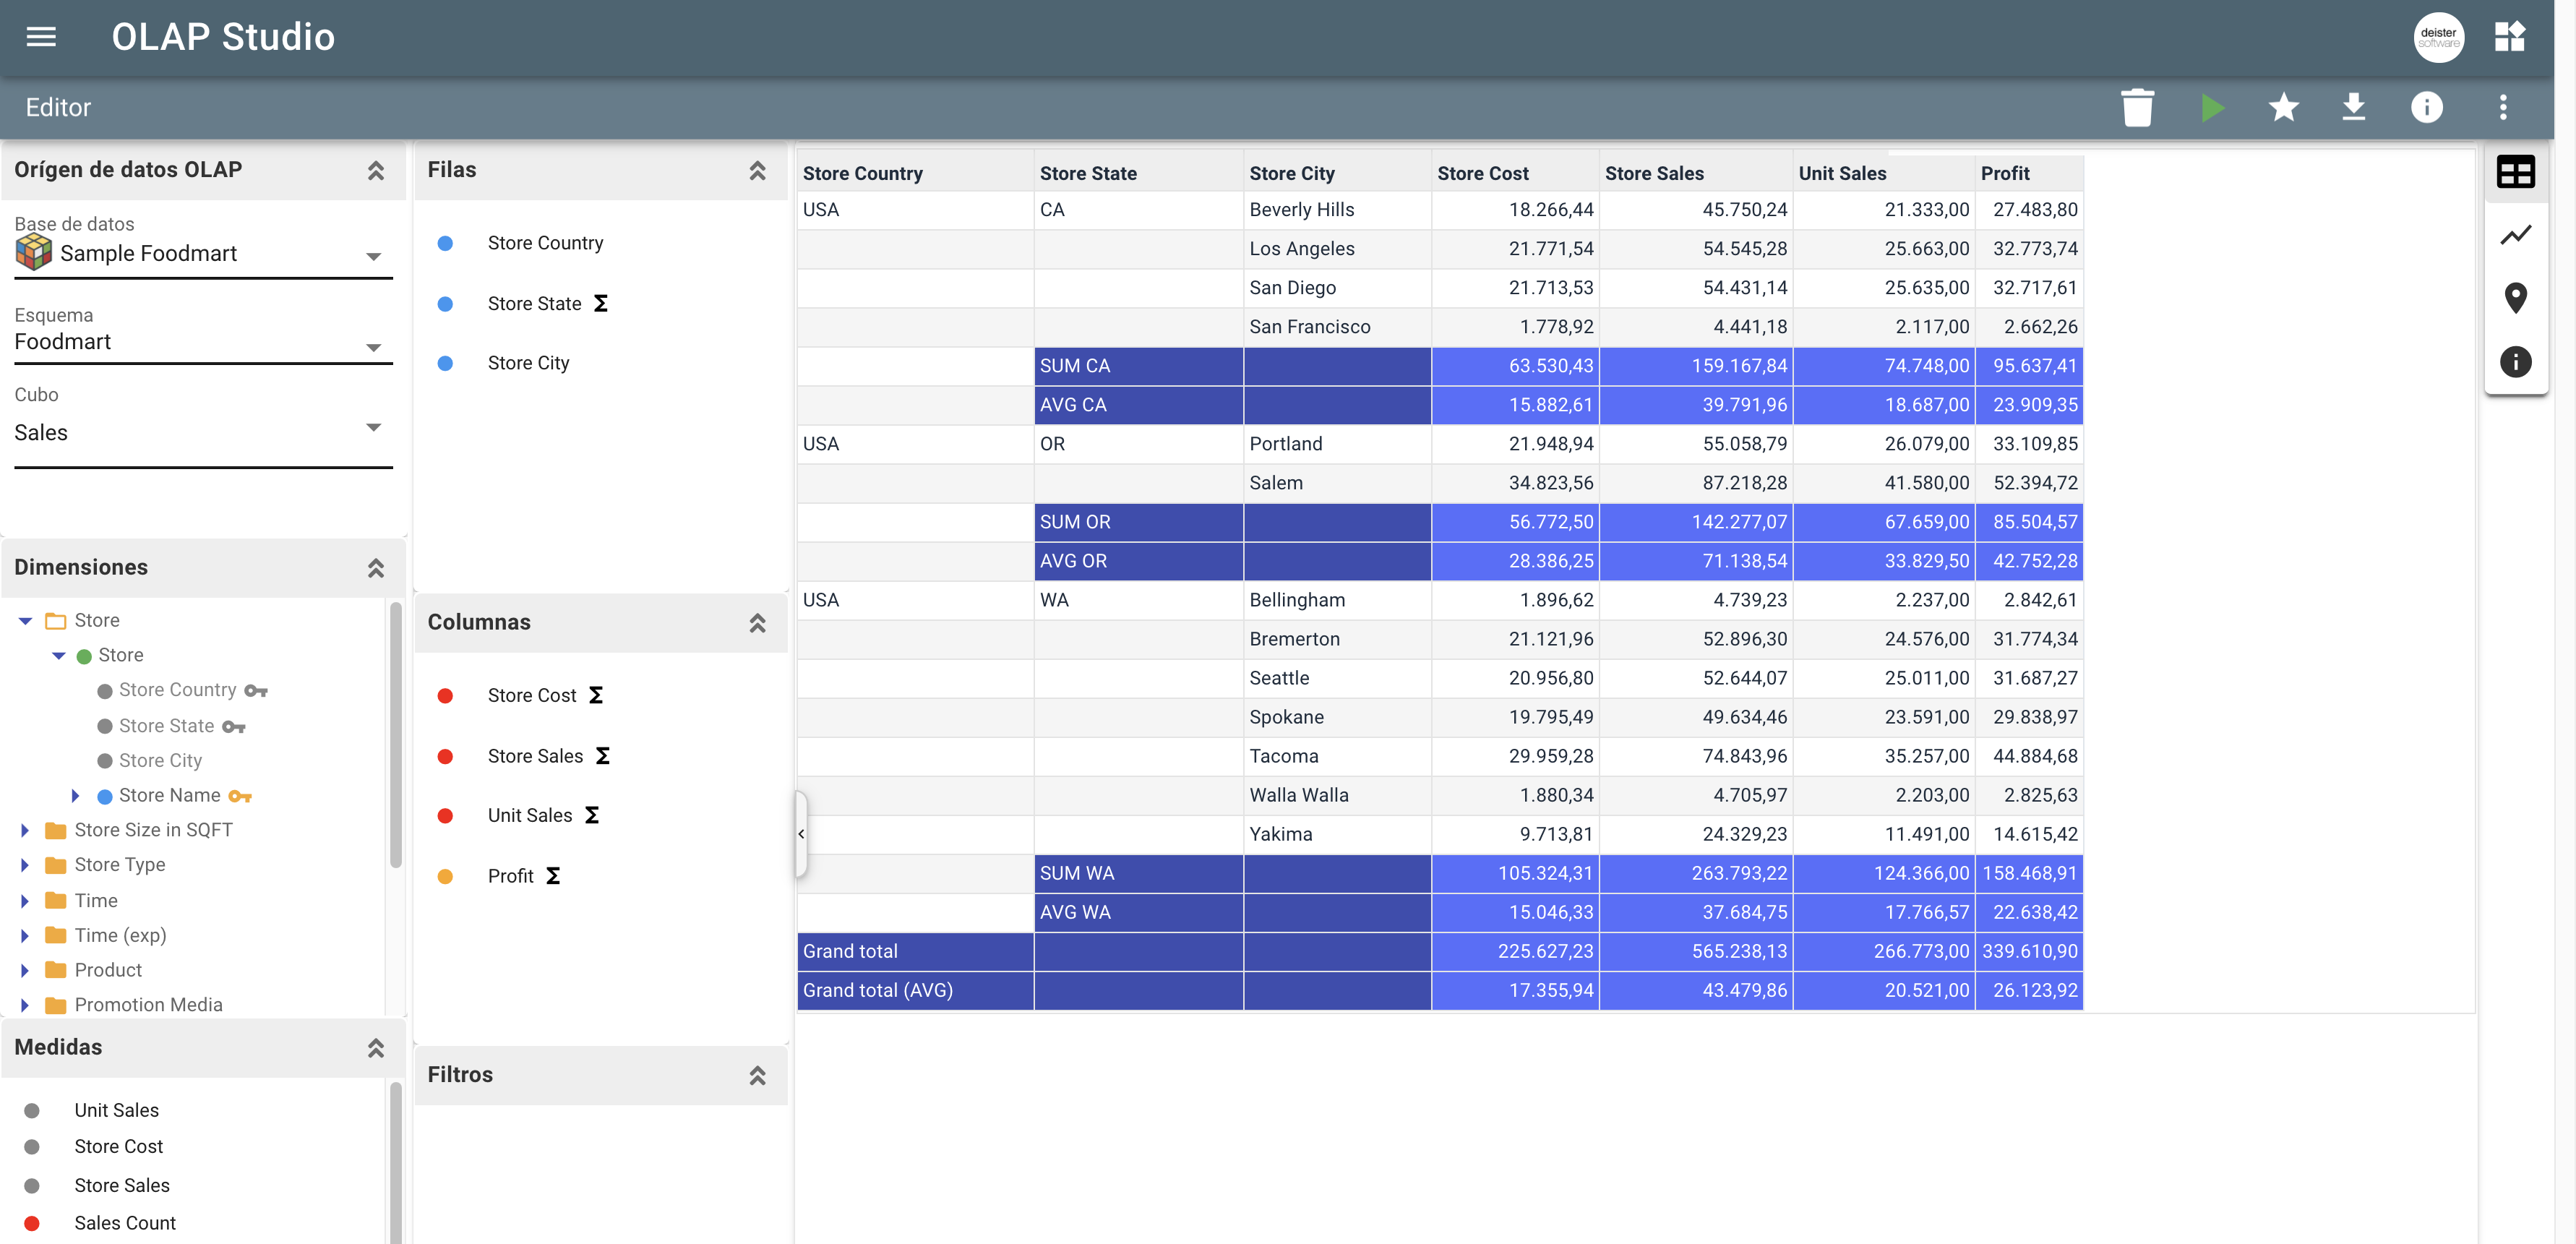
It takes the current aggregation level of data values and aggregates one or more of the dimensions further. Dimensions have hierarchies or formula-based data relationships within each dimension. The roll-up process involves computing all of these data relationships for one or more dimensions in order to consolidate, e.g. , aggregating all cities to get total regional data.
While such relationships are normally sums in a hierarchy, any type of computational relationship might be defined, such as “profit = sales – expenses”.
When displaying the resulting table, the OLAP client automatically decreases the number of dimensions and/or removes row headers.
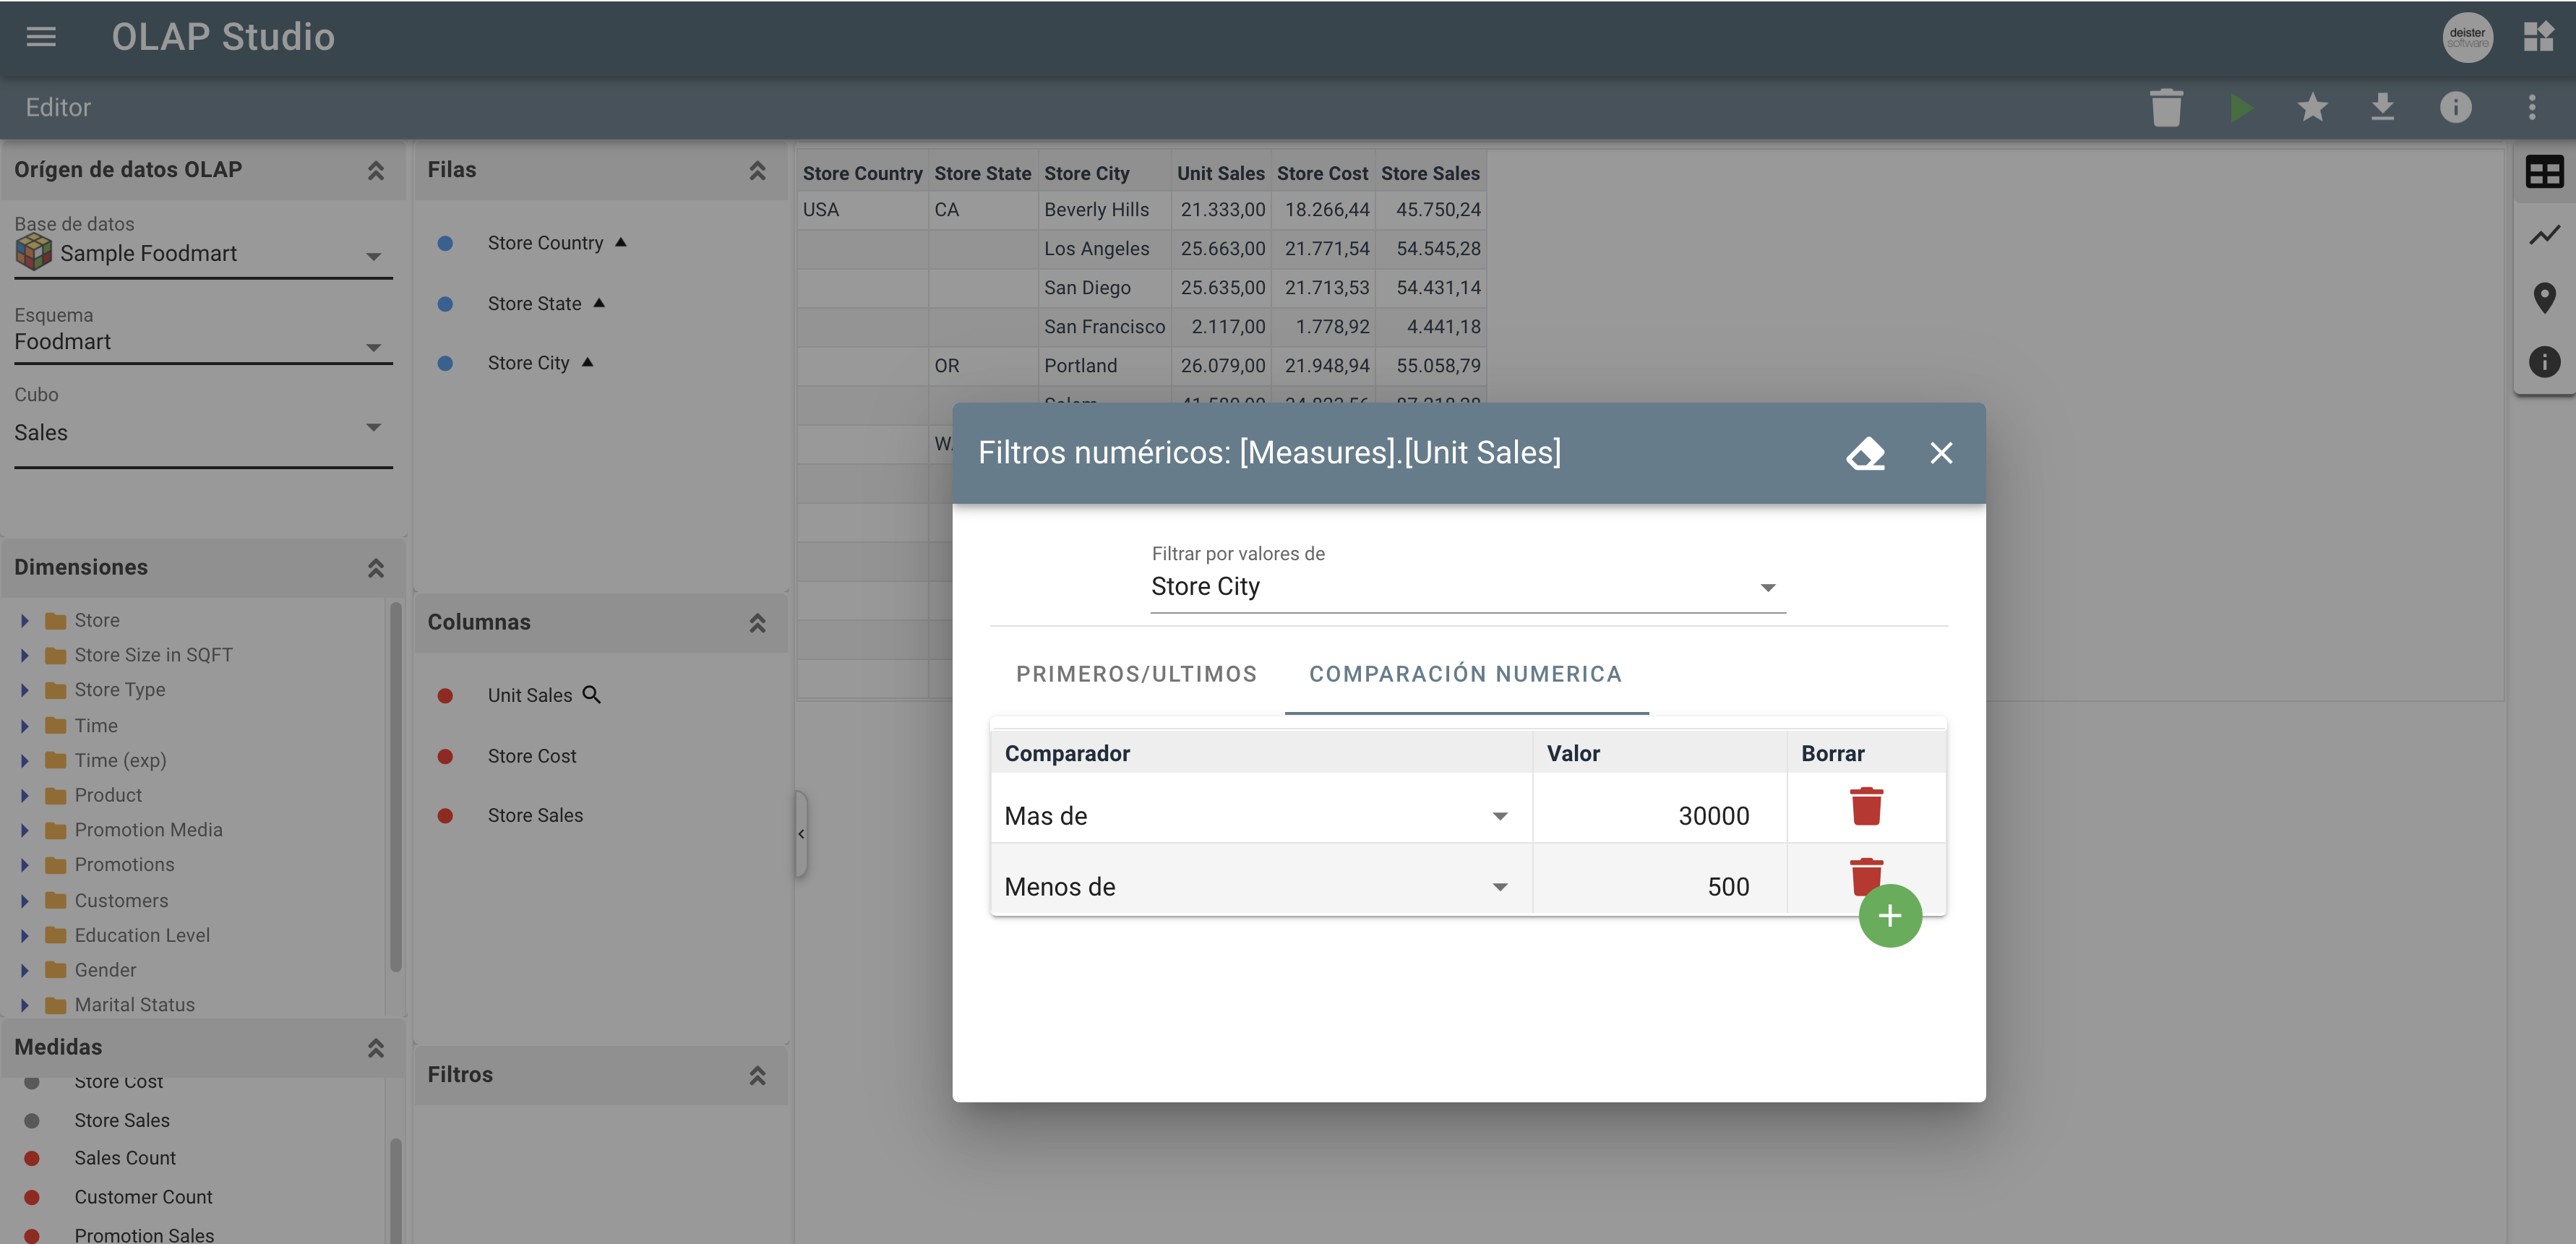
The user can navigate easily across the cube by adding, moving or altering the order of dimensions and measurements in the rows and columns. The OLAP client offers sophisticated filtering capabilities, allowing the user to preselect a set of values for one or more members of a dimension. With this filtering, the user can perform Scoping, or restricting the view of database objects to a specified subset. Further operations, such as updating or retrieval, affect only the cells in the specified subset.
Using the Nesting display technique, the user can view the results of a multidimensional query that returns a subcube, i.e., more than a two-dimensional slice or page. The row/column labels will display the output’s extra dimensions by nesting the labels which describe the members of each dimension. For example, the display columns may be:

These columns contain two dimensions, nested in the user’s preferred arrangement. Likewise, a report’s rows may contain nested dimensions (pivoting the last example):
The user can easily navigate across the cube by adding, moving or altering the order of dimensions and measurements in the rows and columns. The OLAP client offers sophisticated filtering capabilities, allowing the user to preselect a set of values for one or more members of a dimension.
Graphs, charts and maps
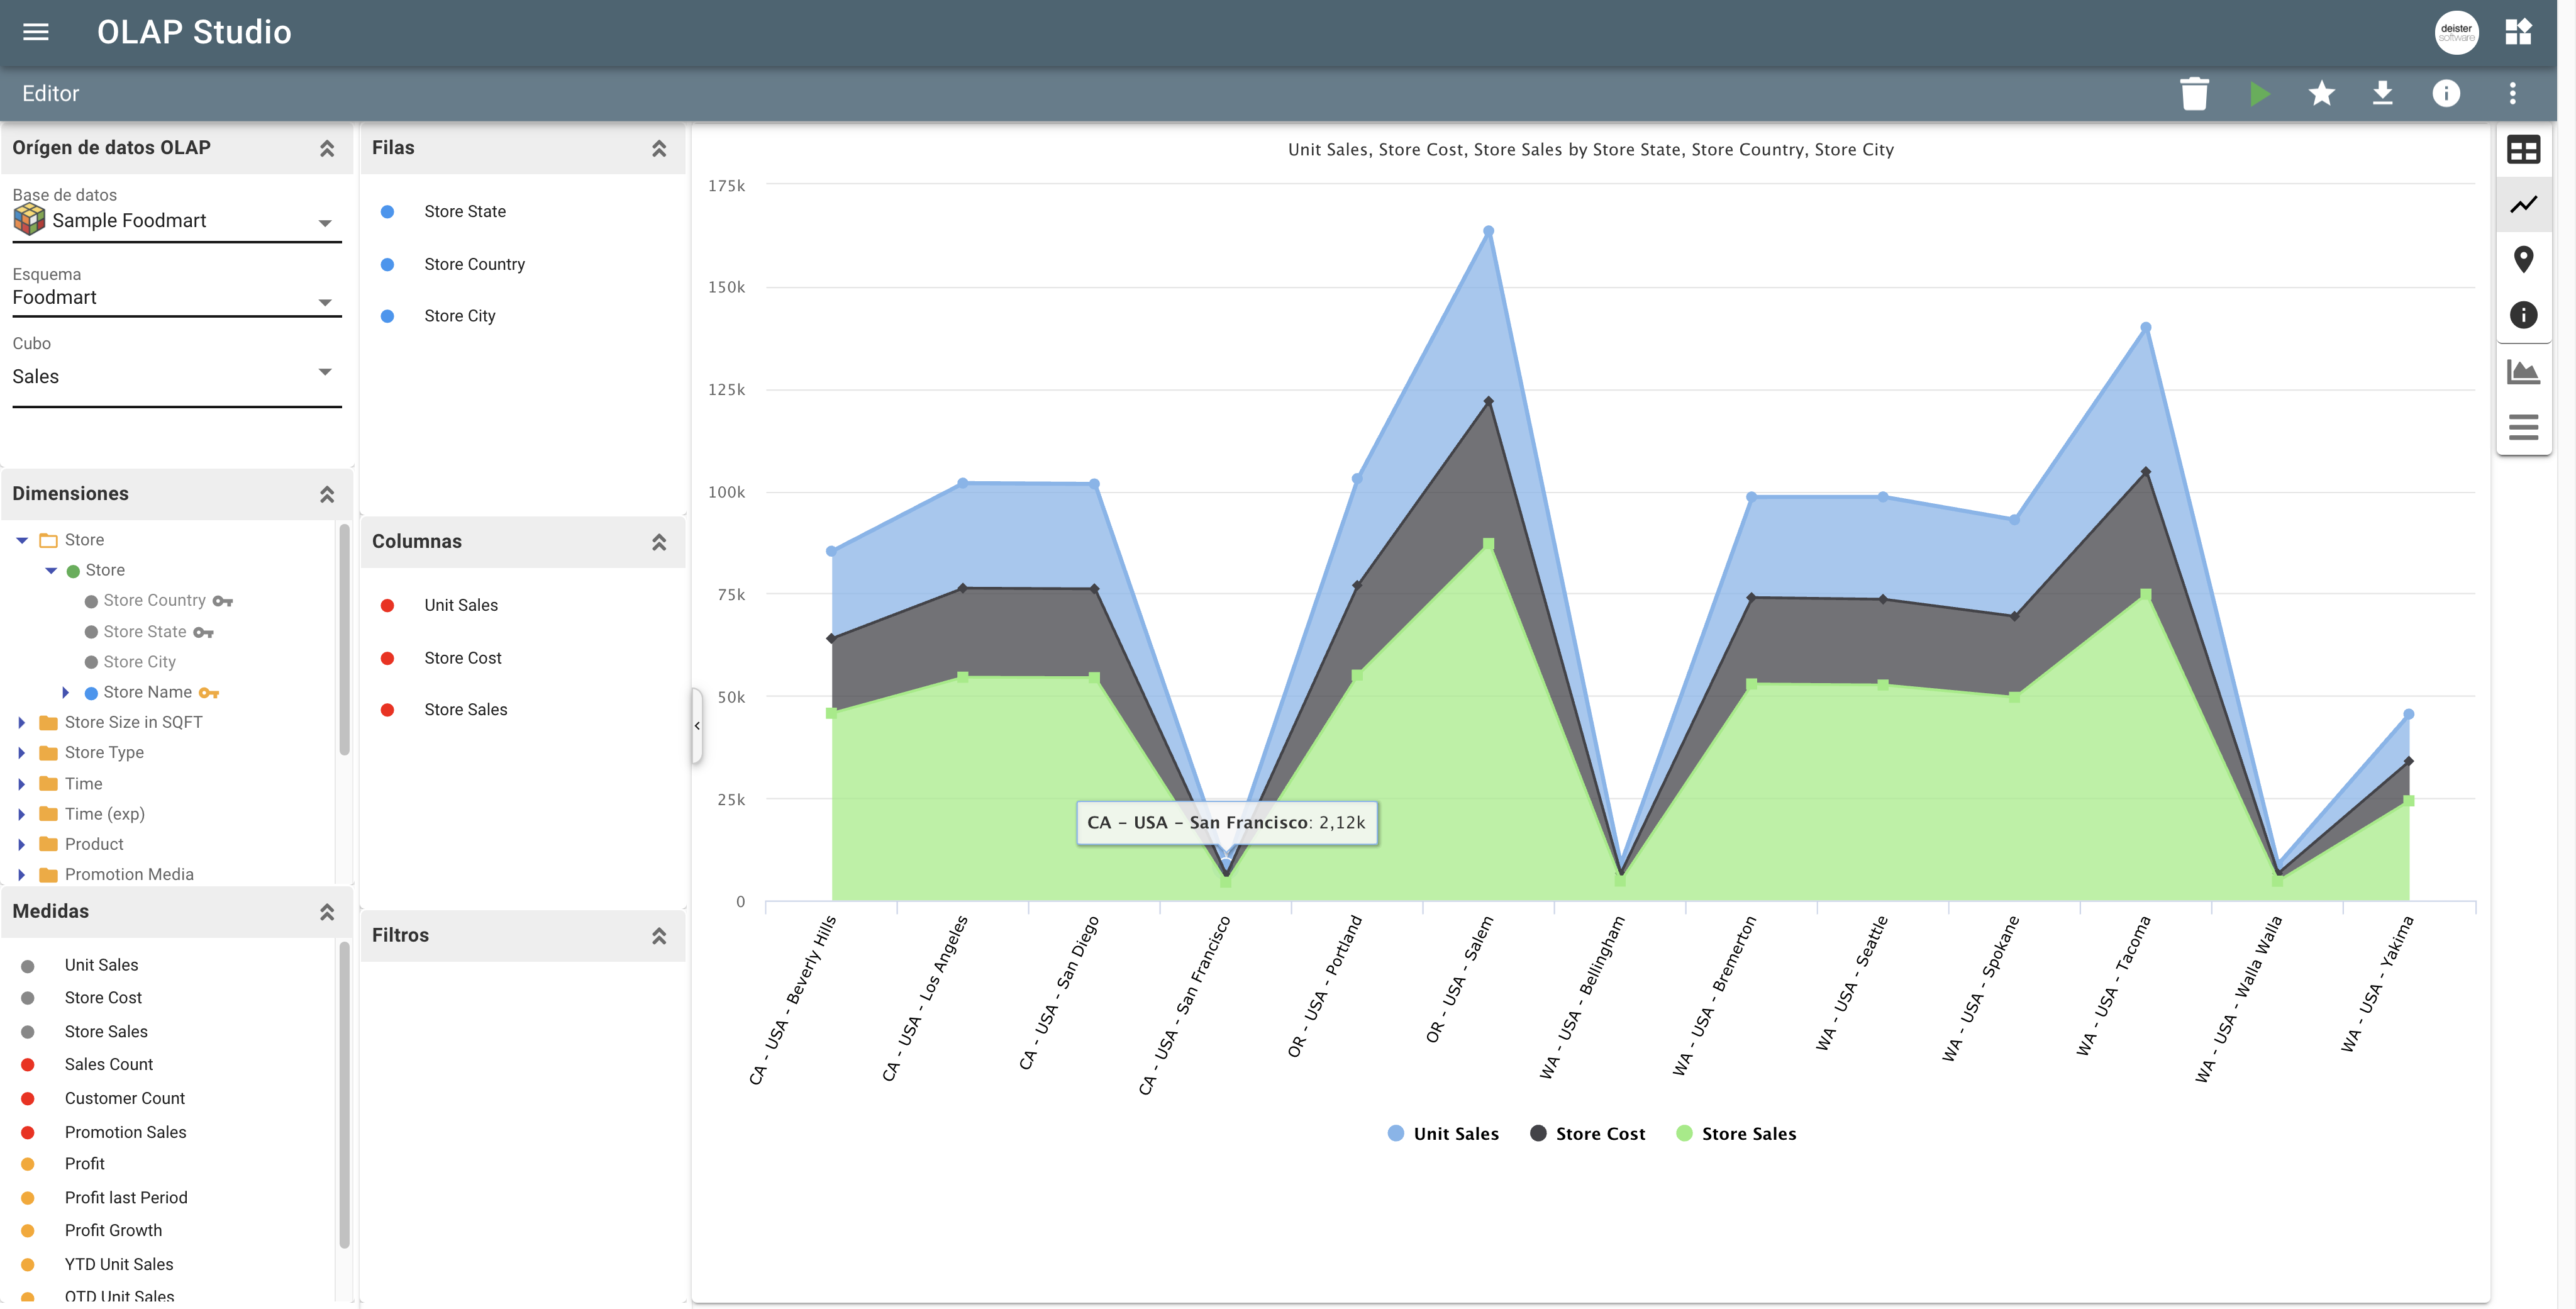
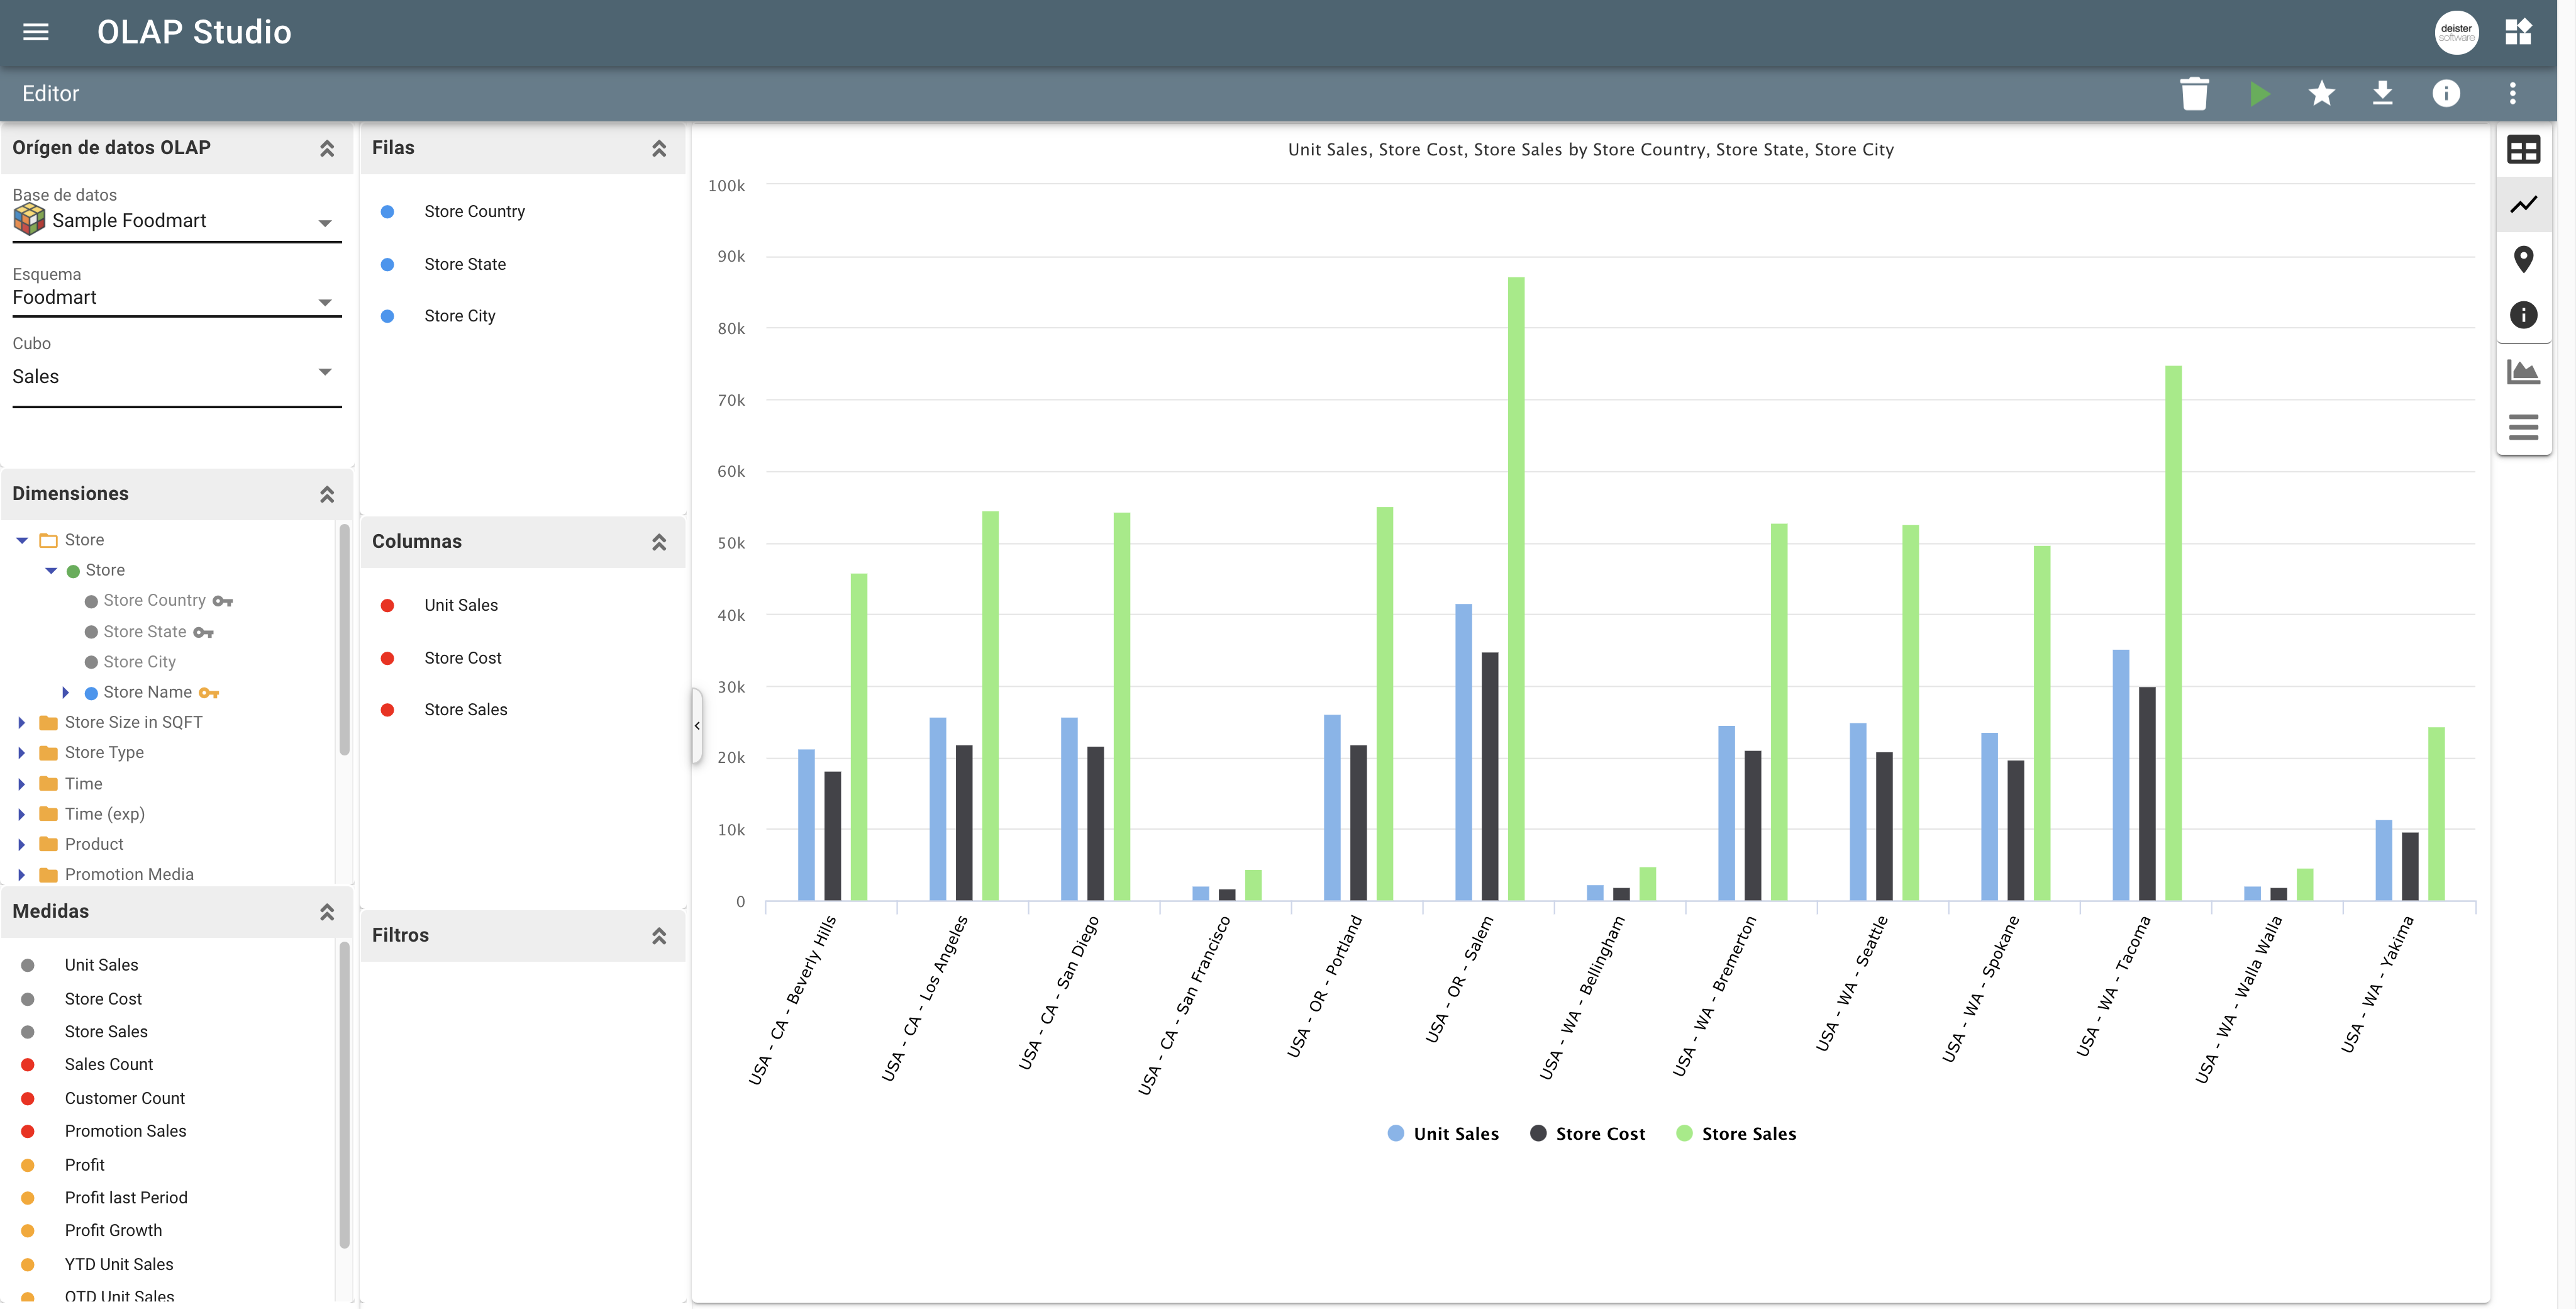
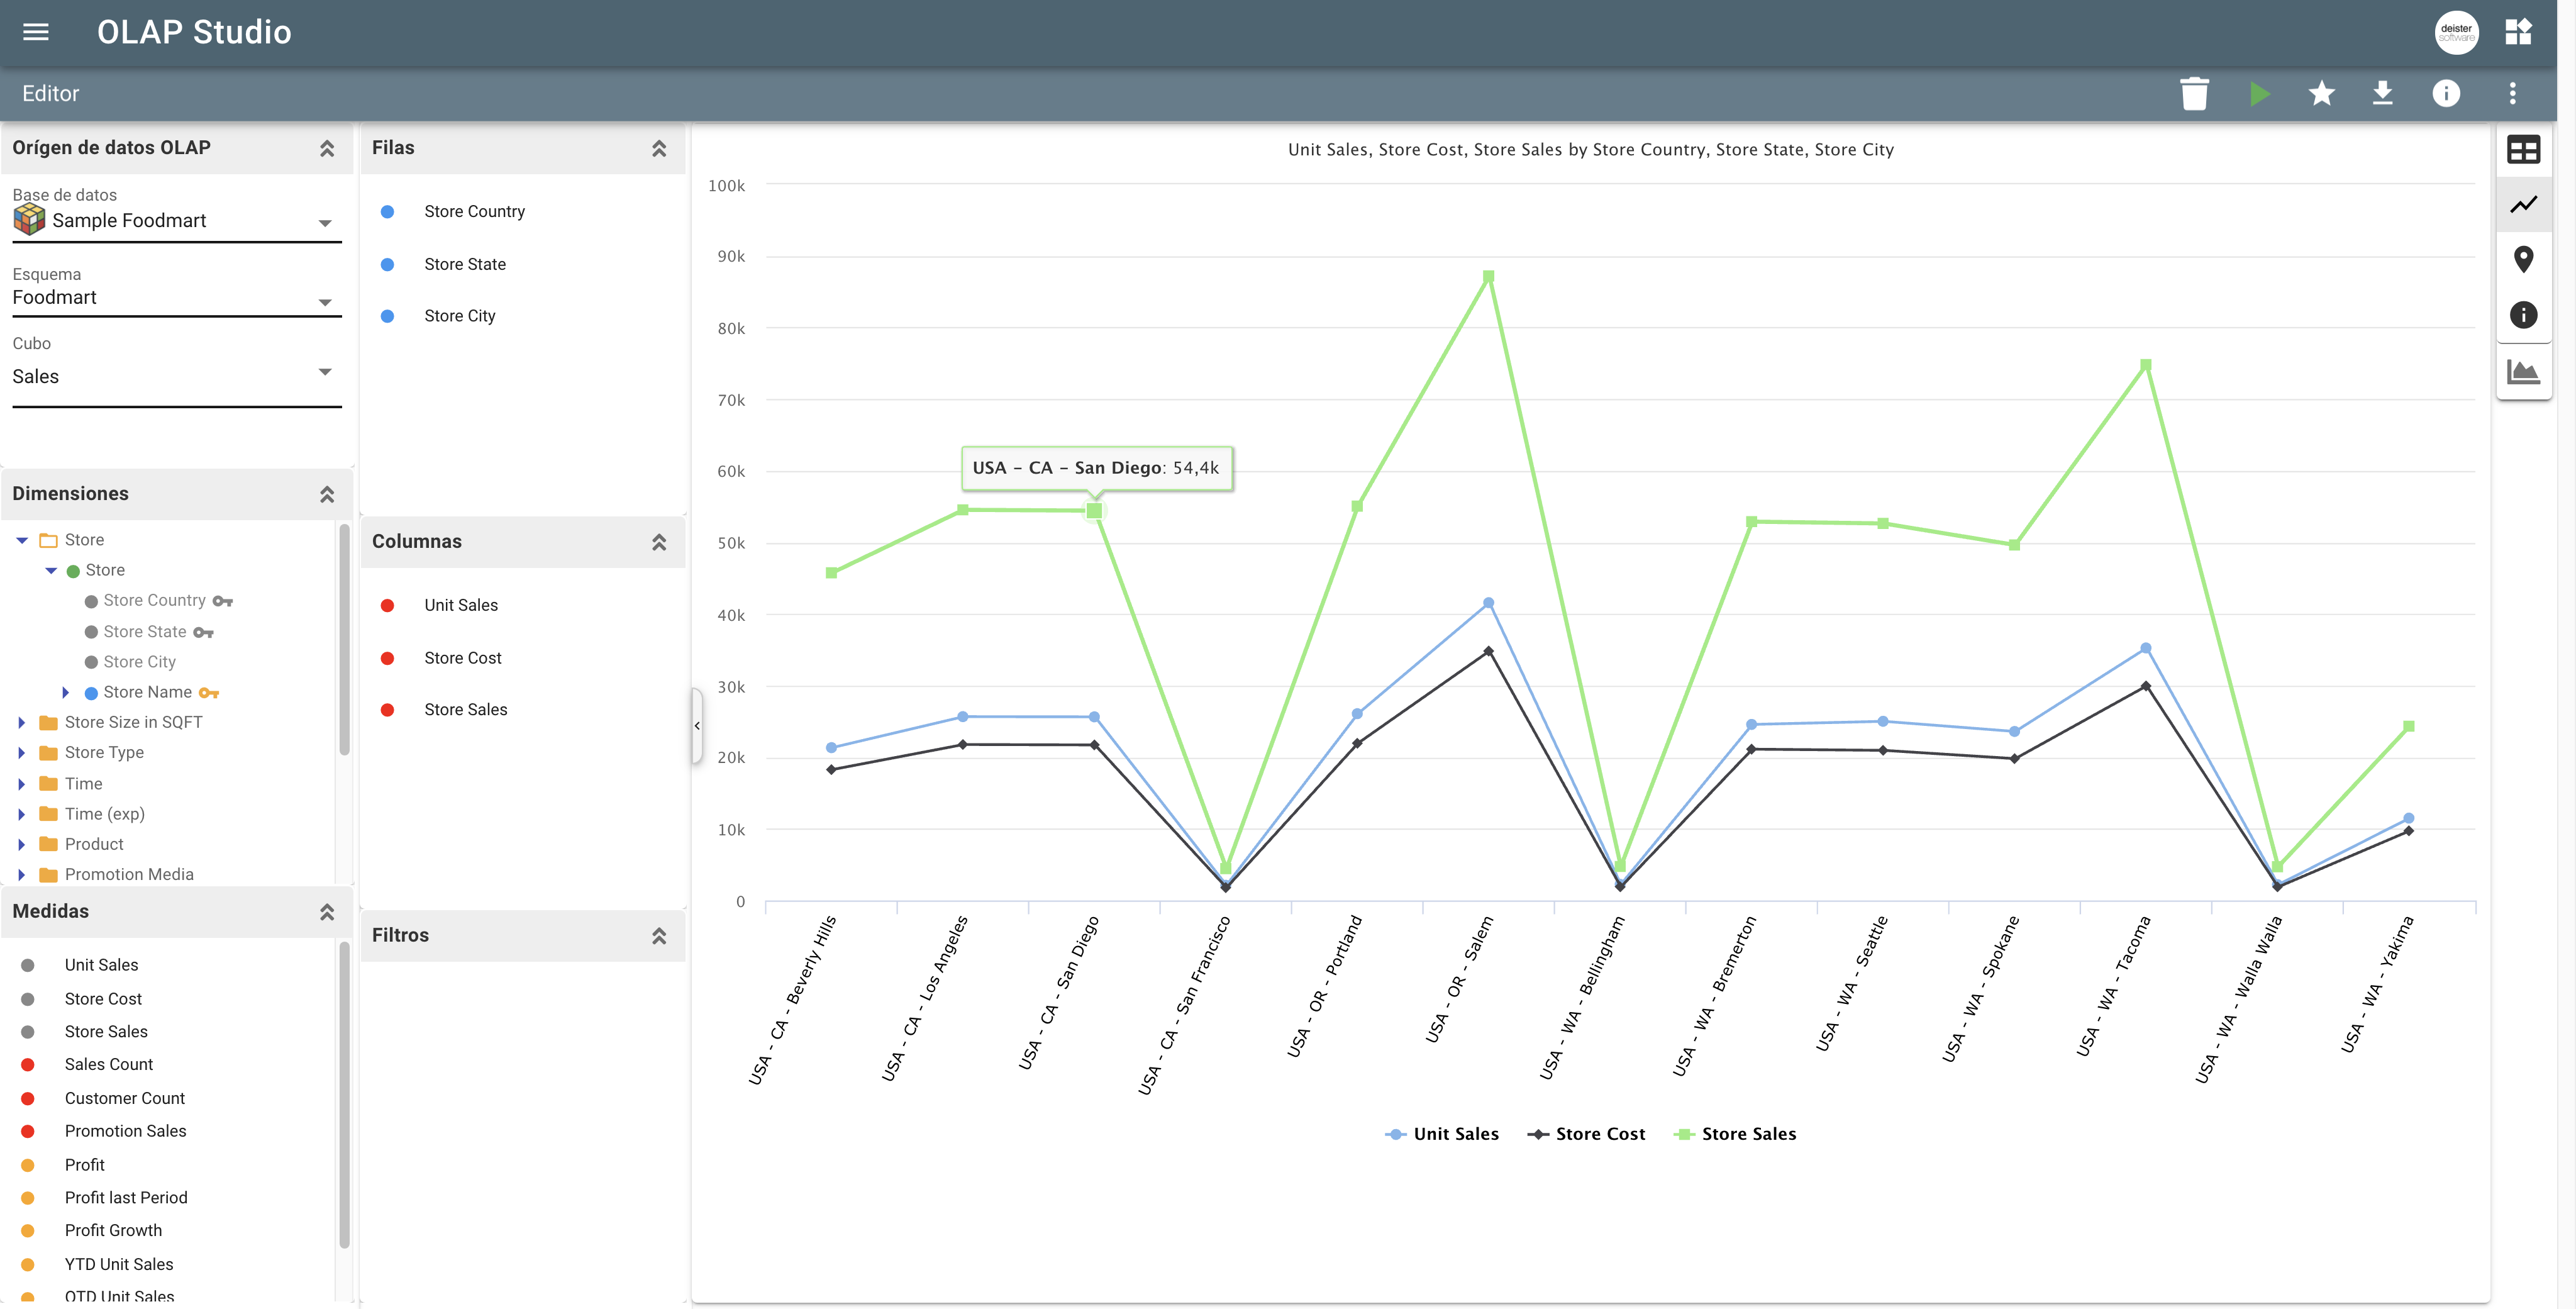
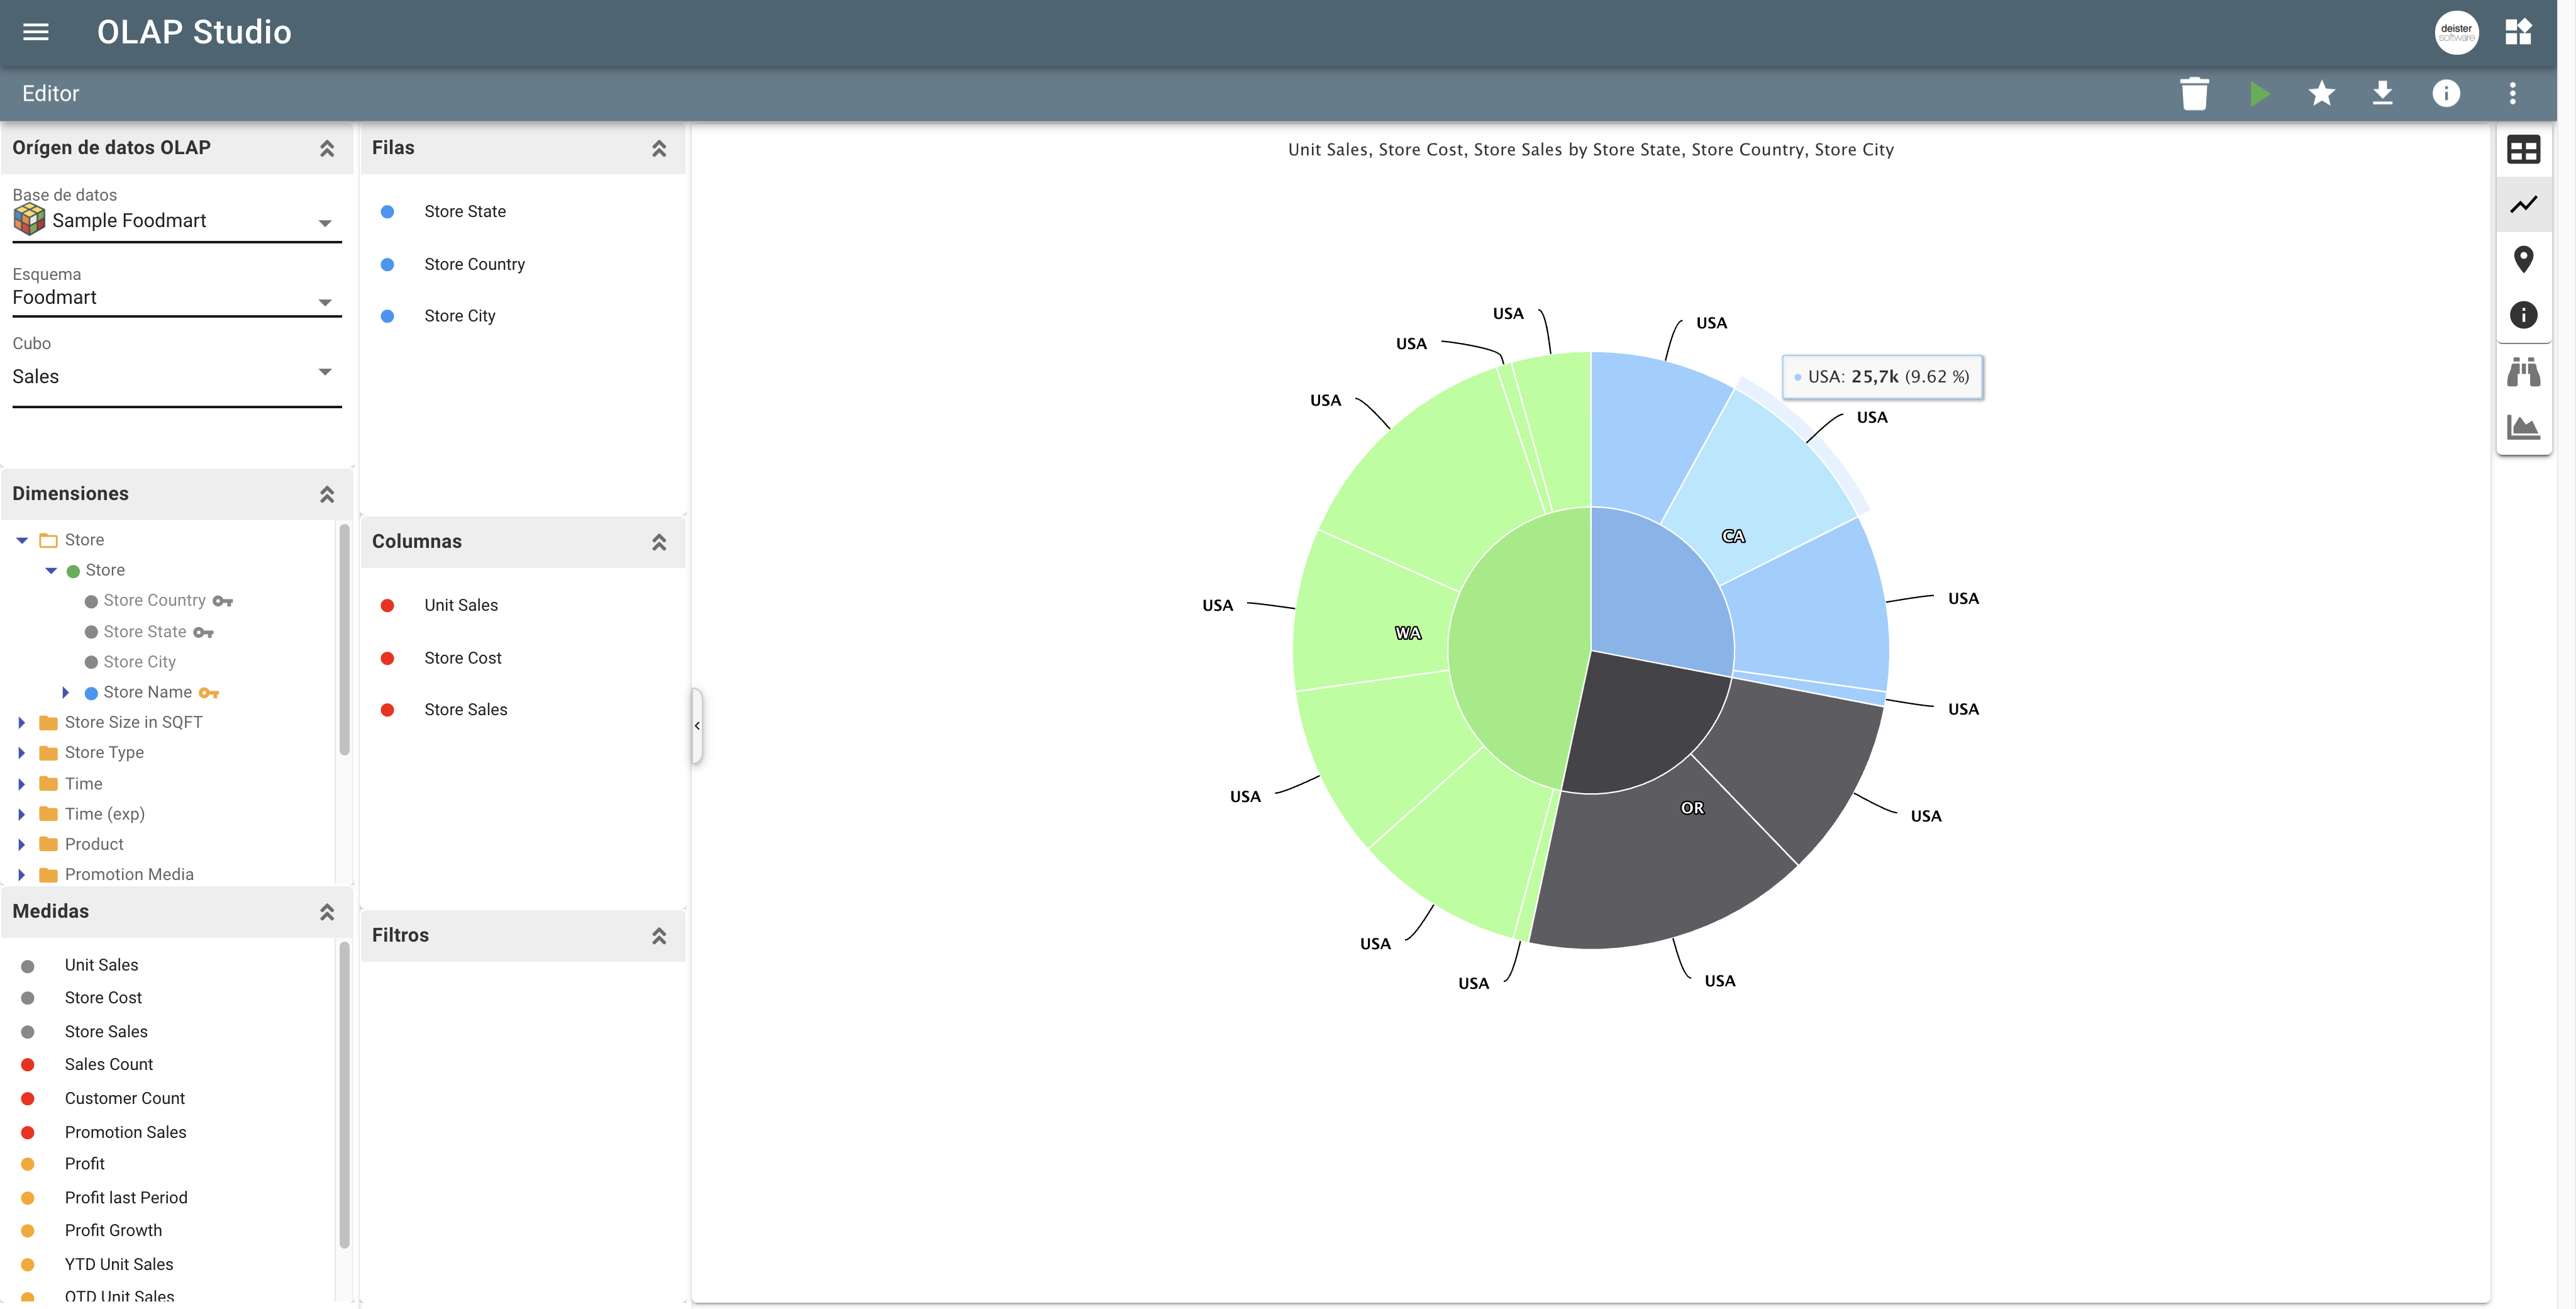
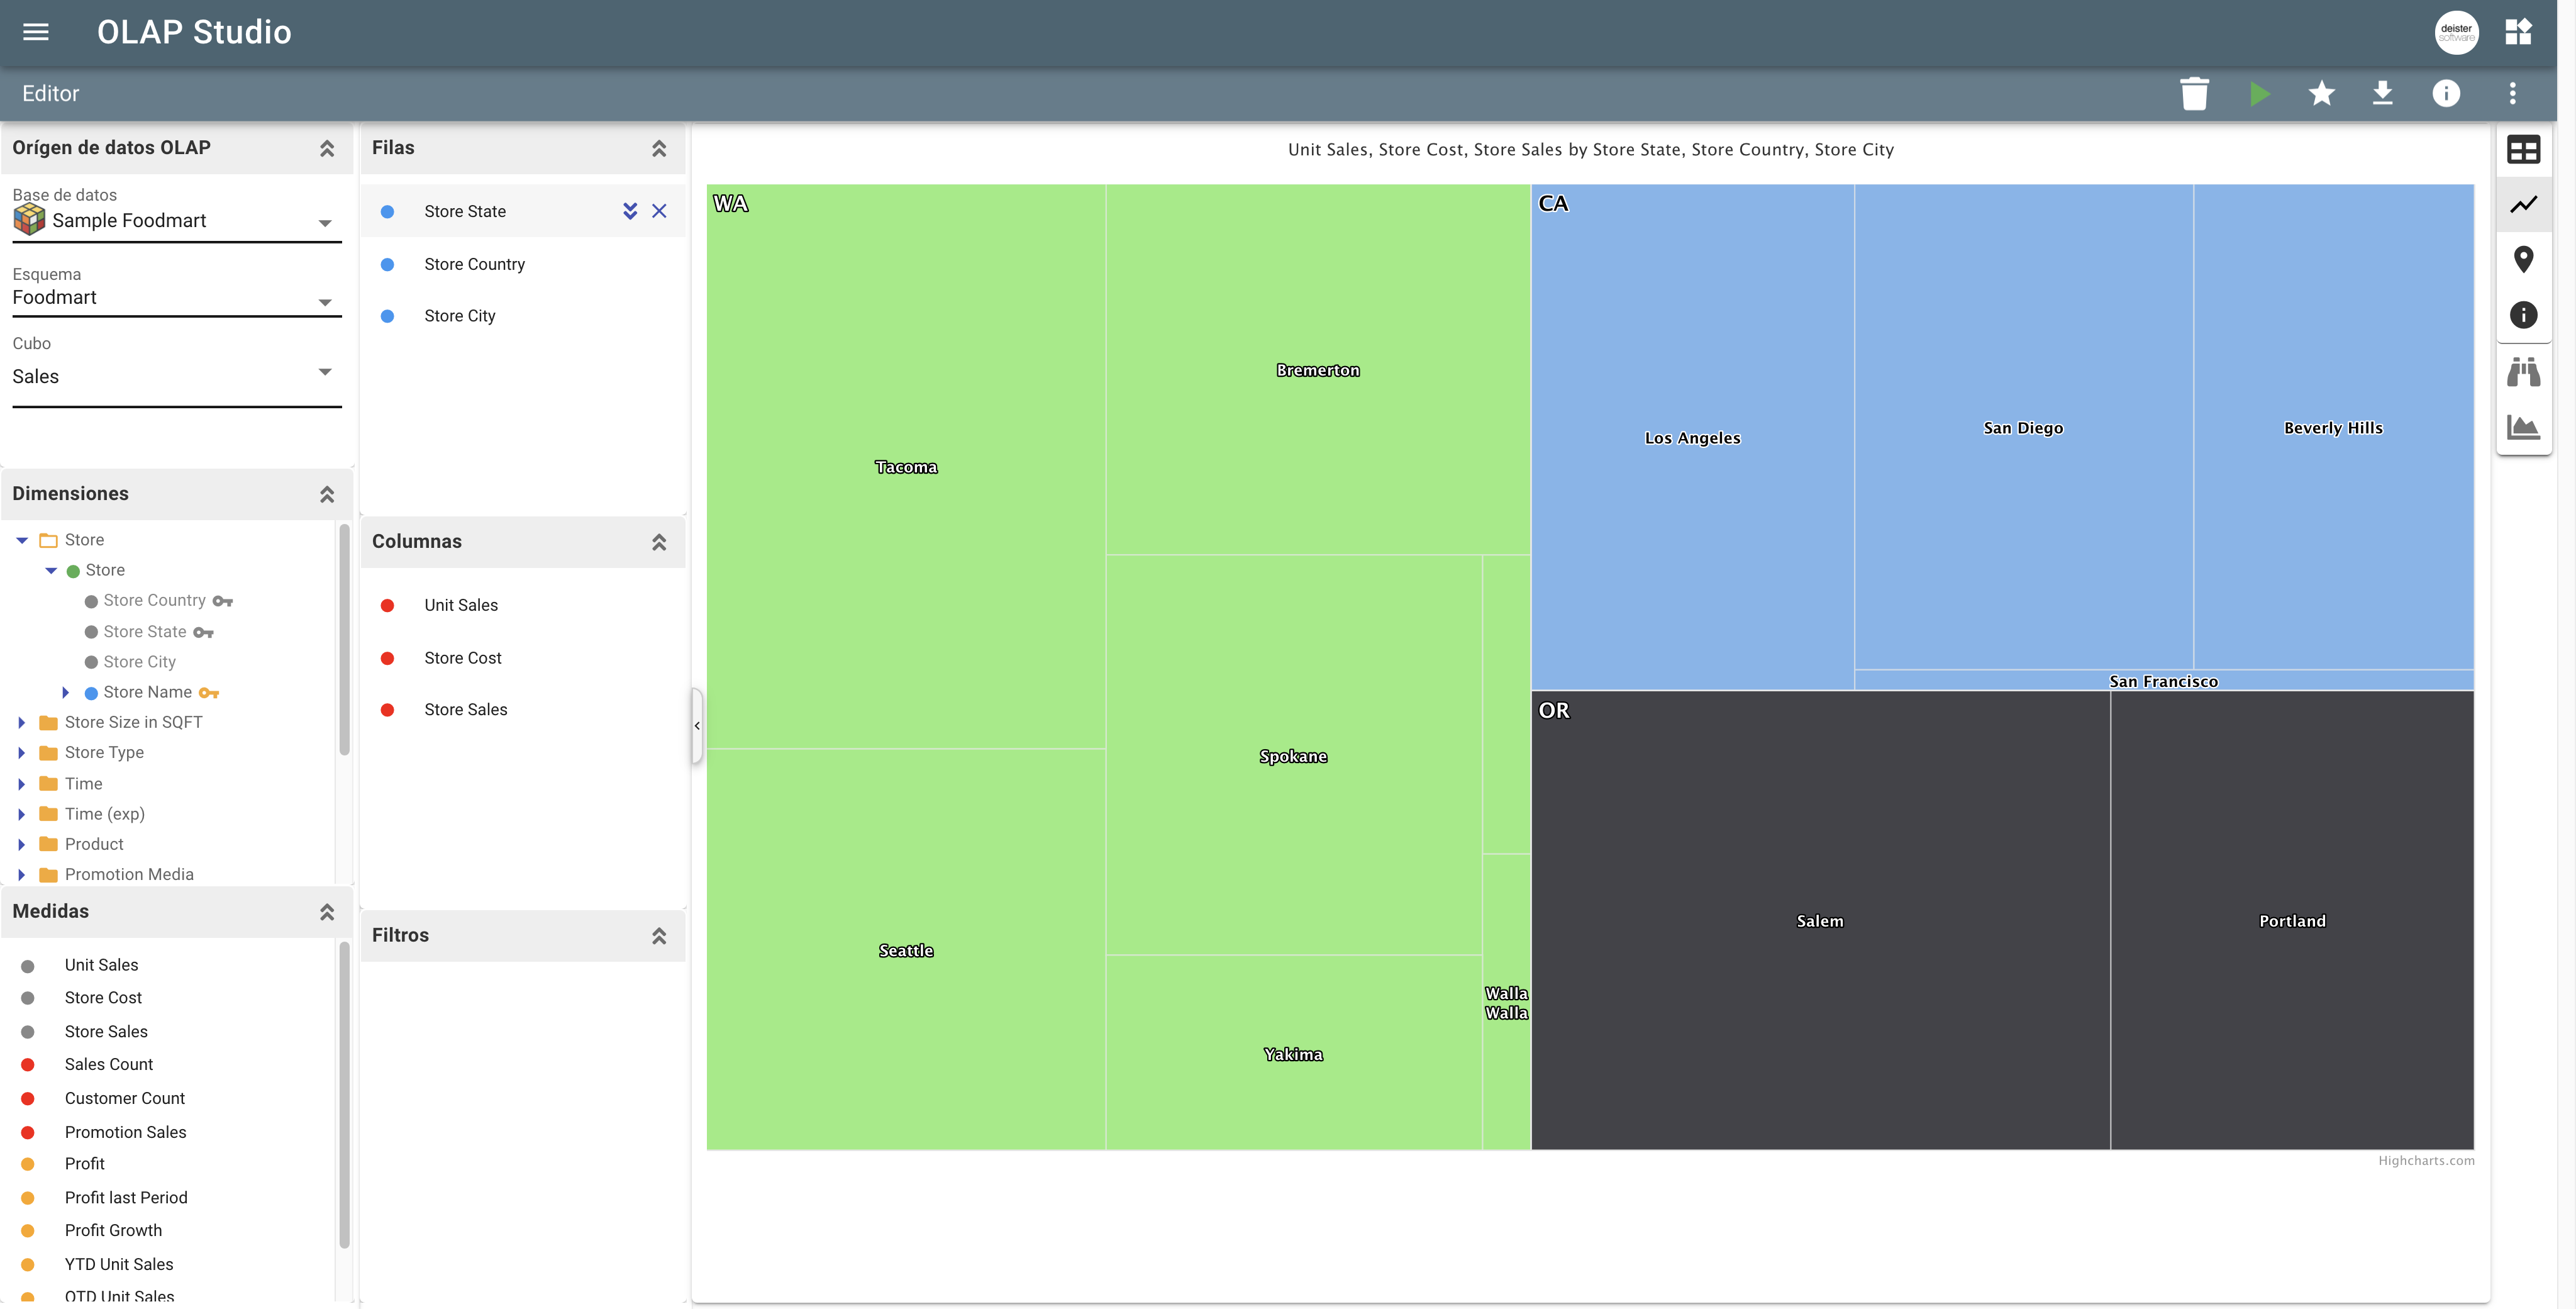
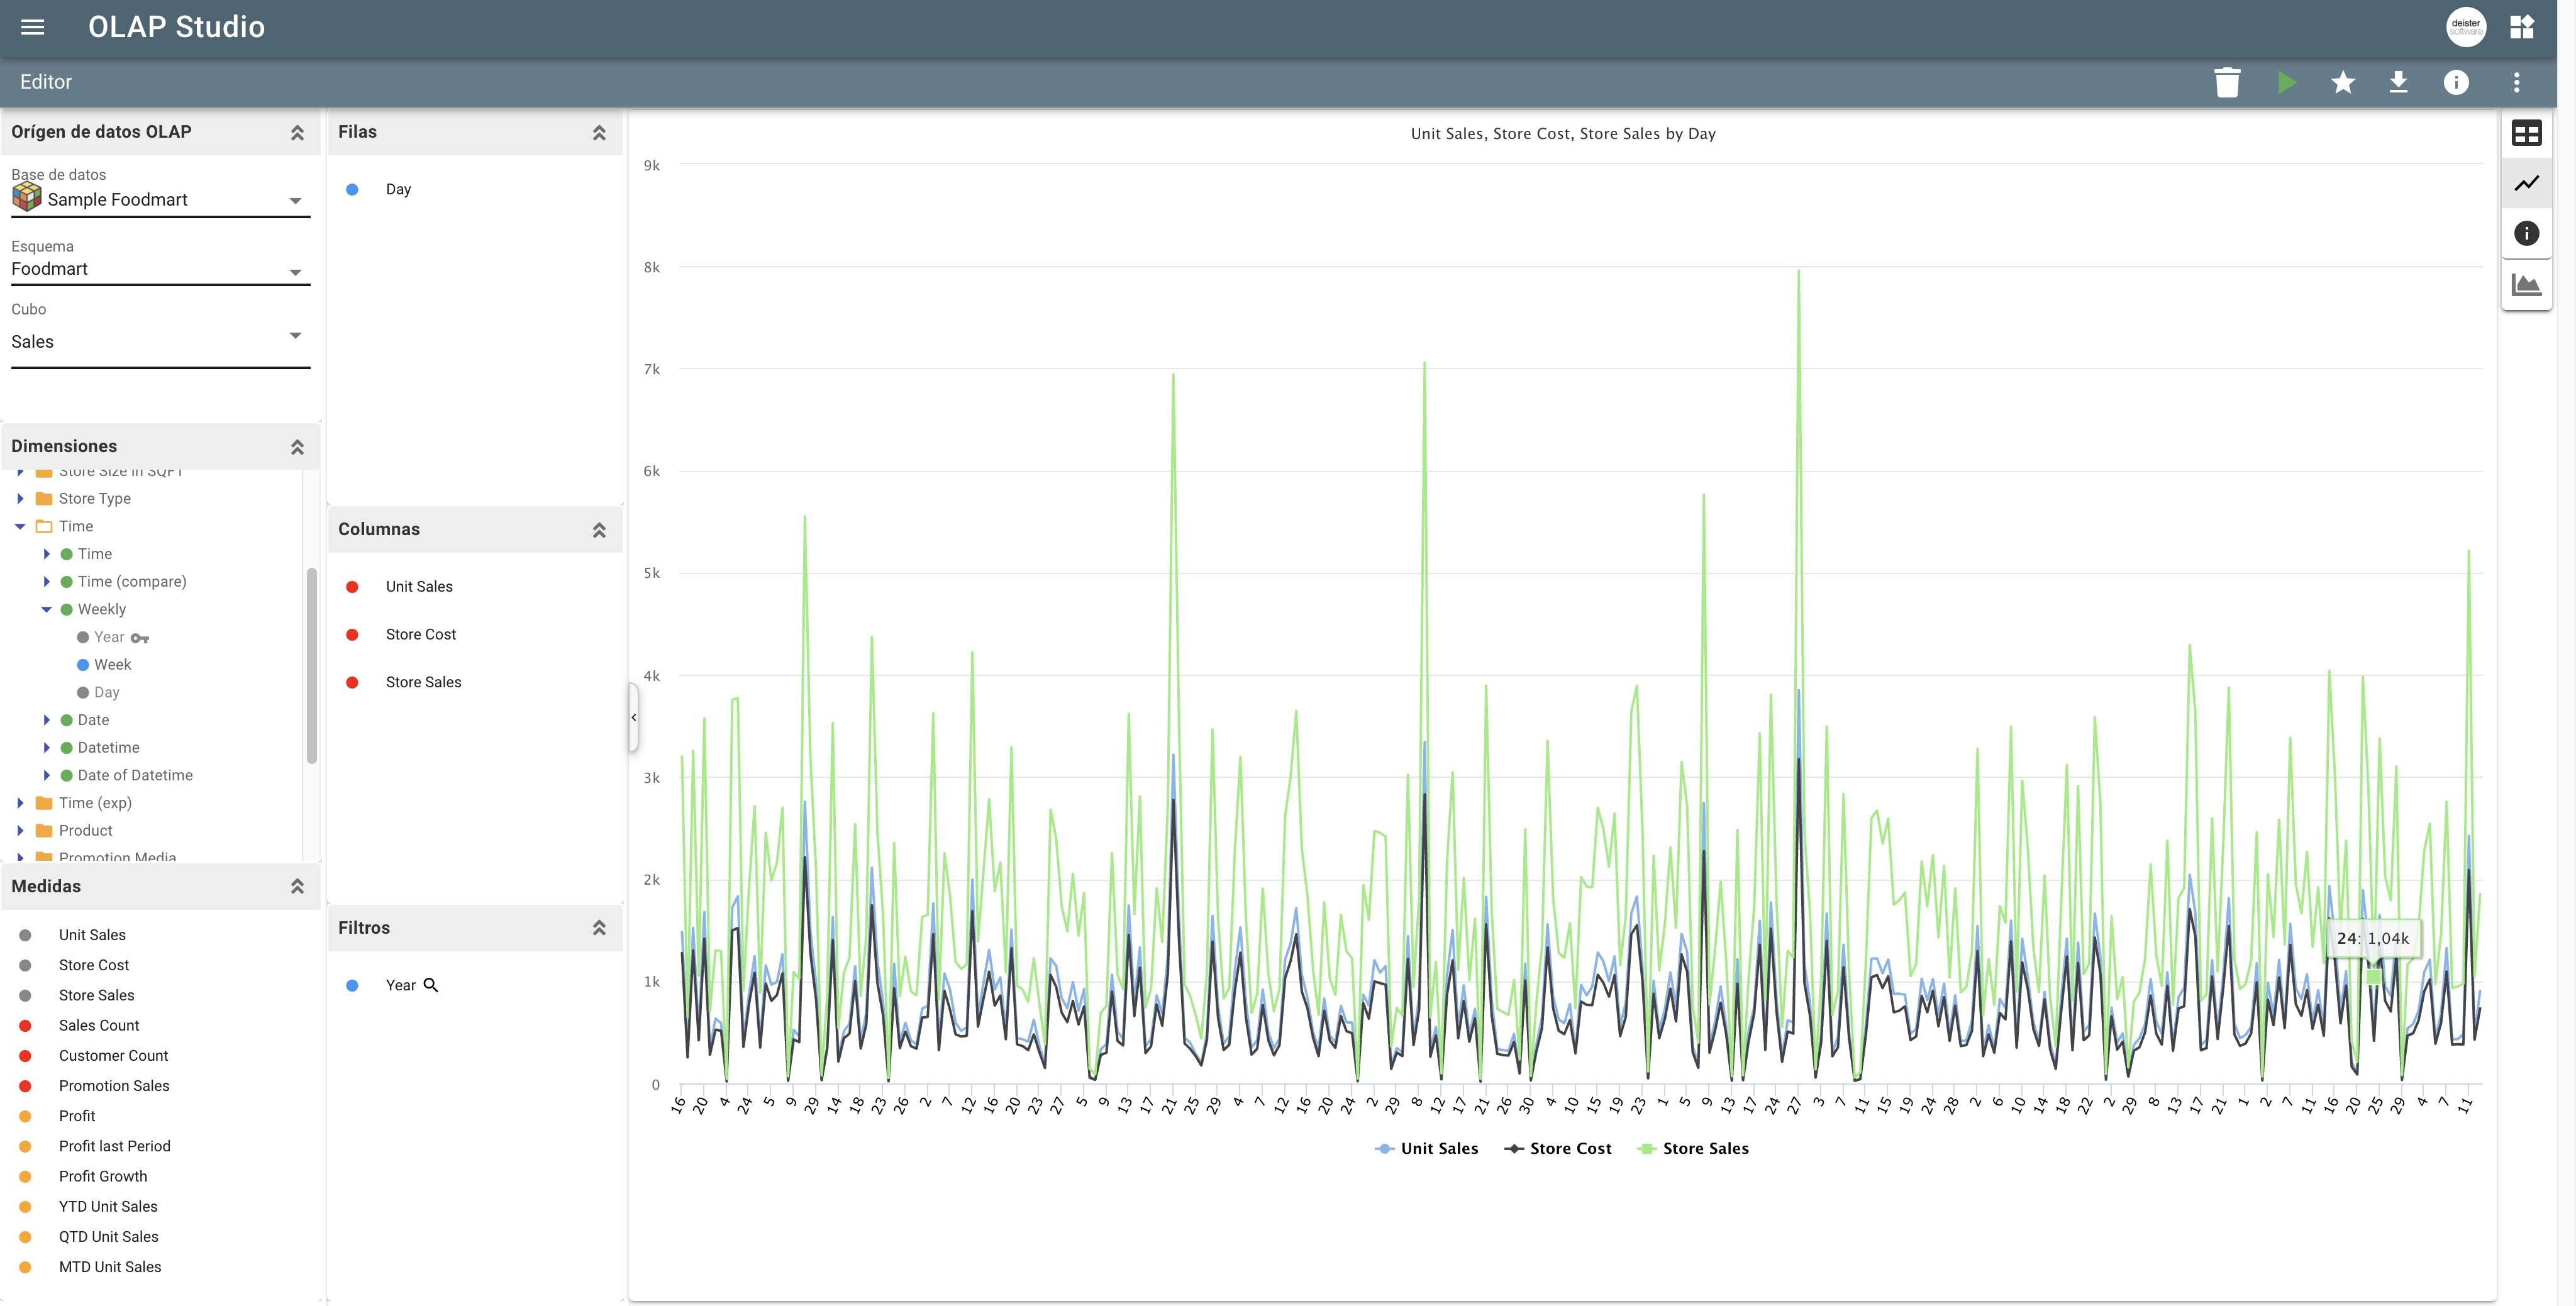
This tool includes powerful graphical capabilities which give business users the flexibility to dynamically obtain reports and graphs on a highly interactive, easy-to-use web interface. Some types of supported graphics include bars (stacked), columns (stacked), pie charts, tree maps, lines or time series:
Mapping
Axional OLAP also includes geospatial analysis capabilities. Generally, most data has a component which makes reference to a place: an address, post code, region, country, set of GPS coordinates, etc. Geospatial mapping makes the visualization, analysis and management of data with a geographical component possible. With Axional DBOLAP, users can create maps which will help visualize data patterns, trends, or exceptions.
The results of geospatial analysis can be represented in various forms of mapping:
- Single-point data: Heat maps and Pins (including clustering capabilities when zooming)
- Two-dimensional data: Multilayer and Thematic maps (including color ranges, legends, and layer visibility toggling)
With all its features, this client from Axional Analytics provides users instant access to the most meaningful and relevant information their business demands.

Interfaces
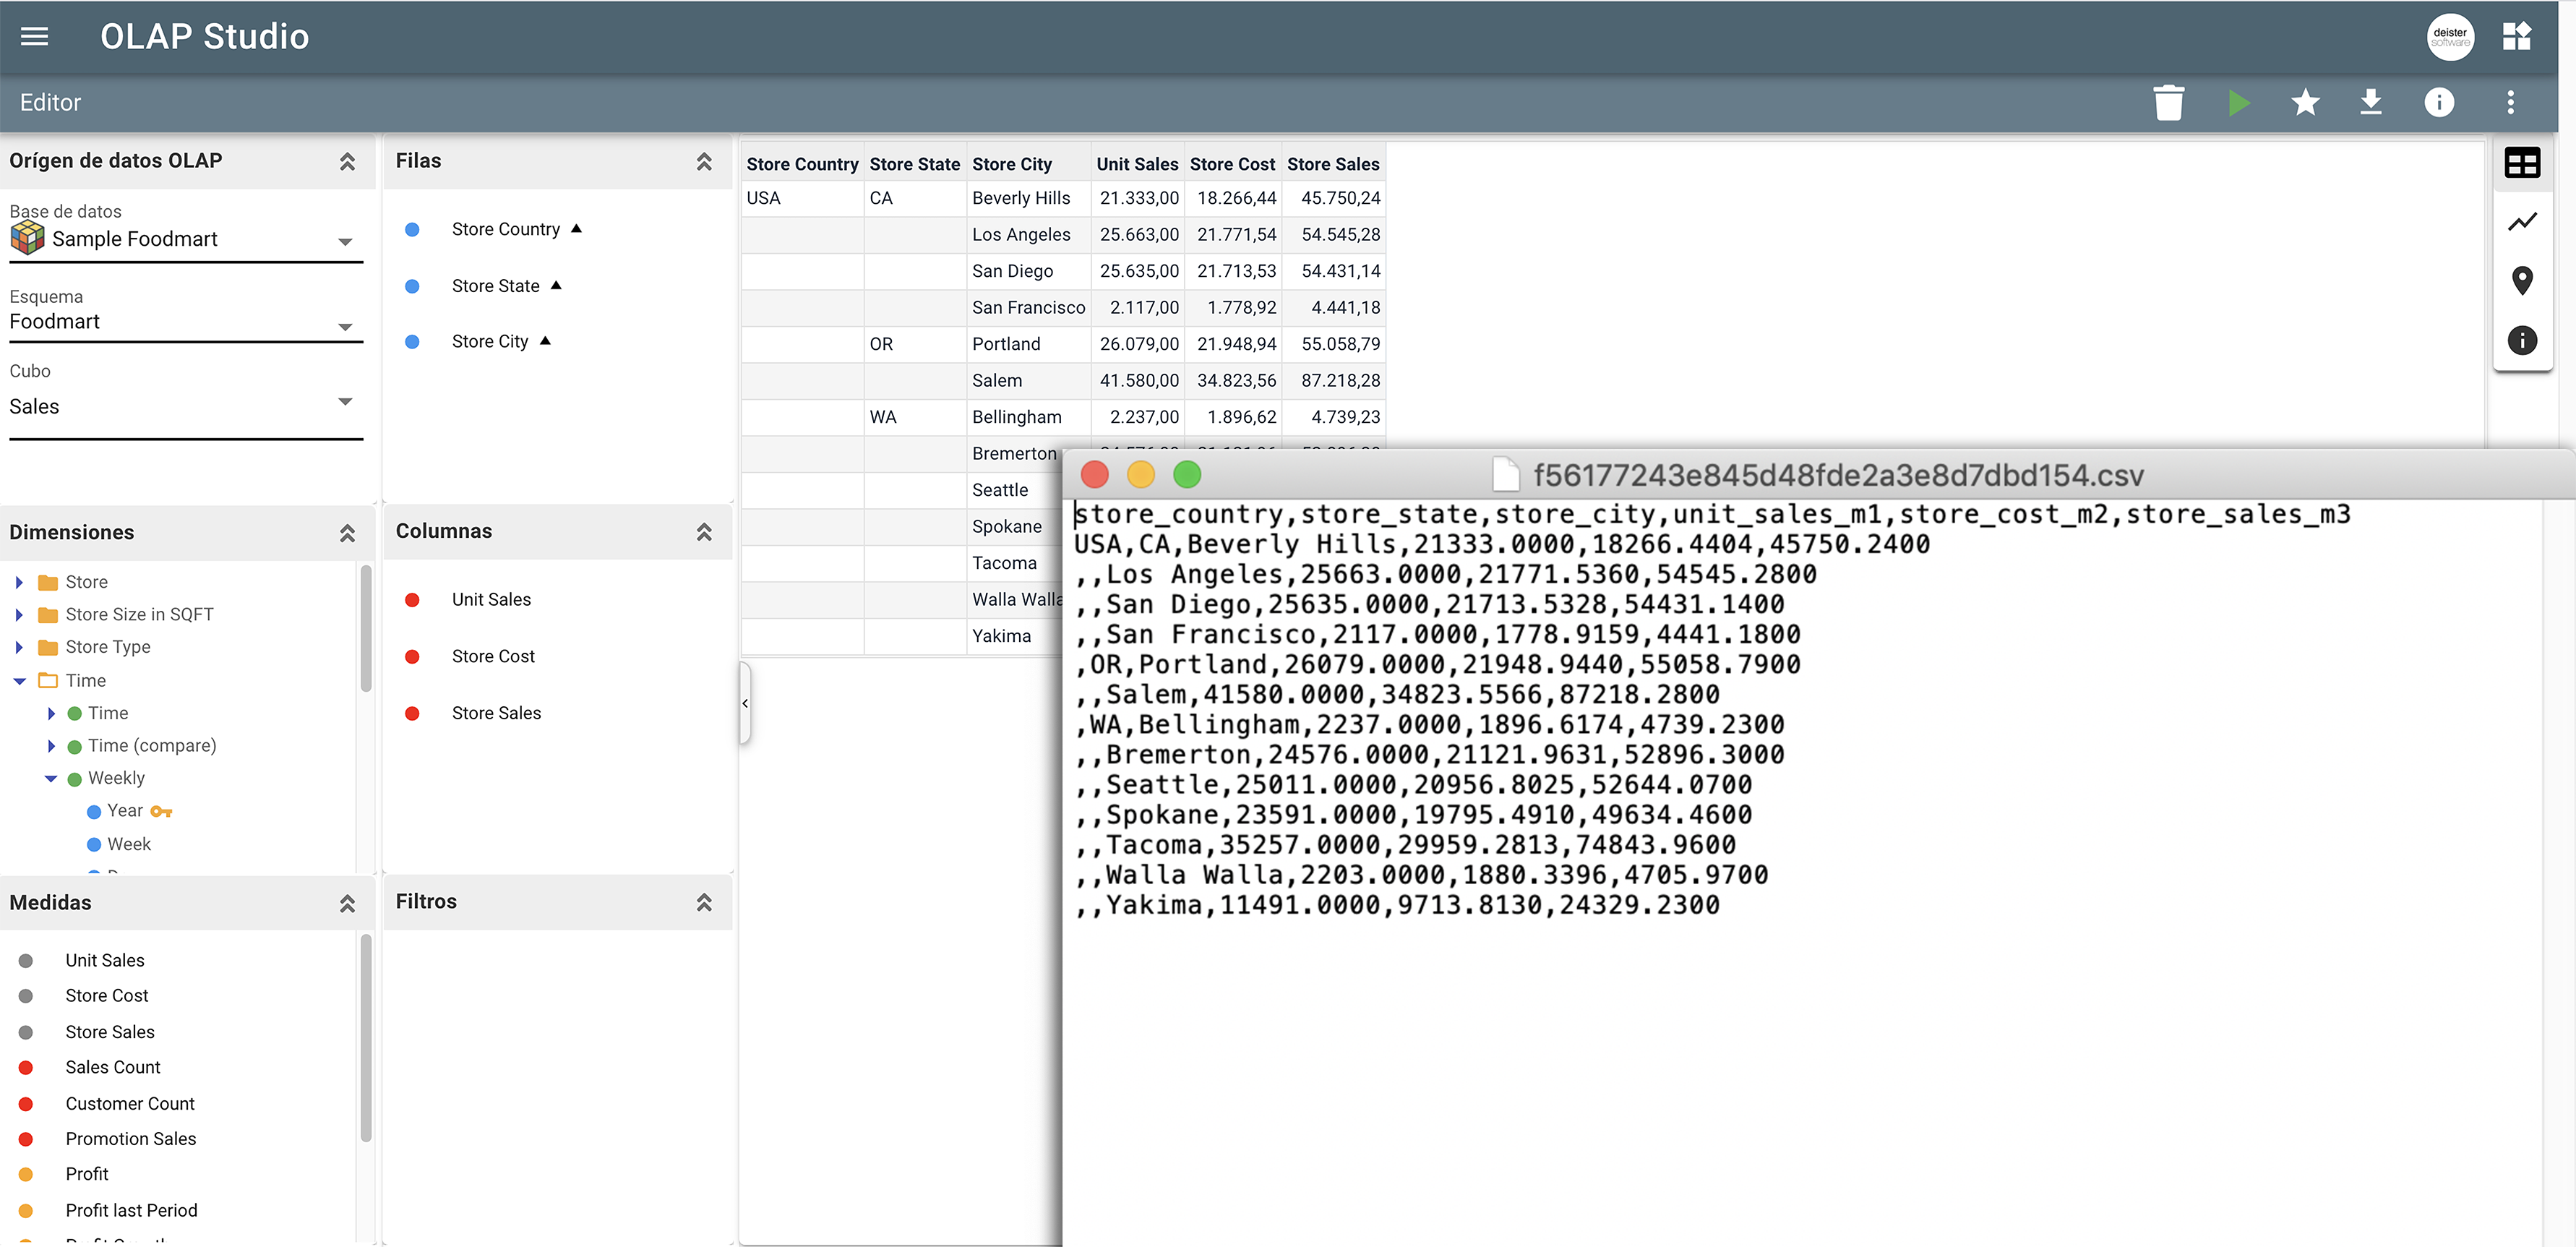
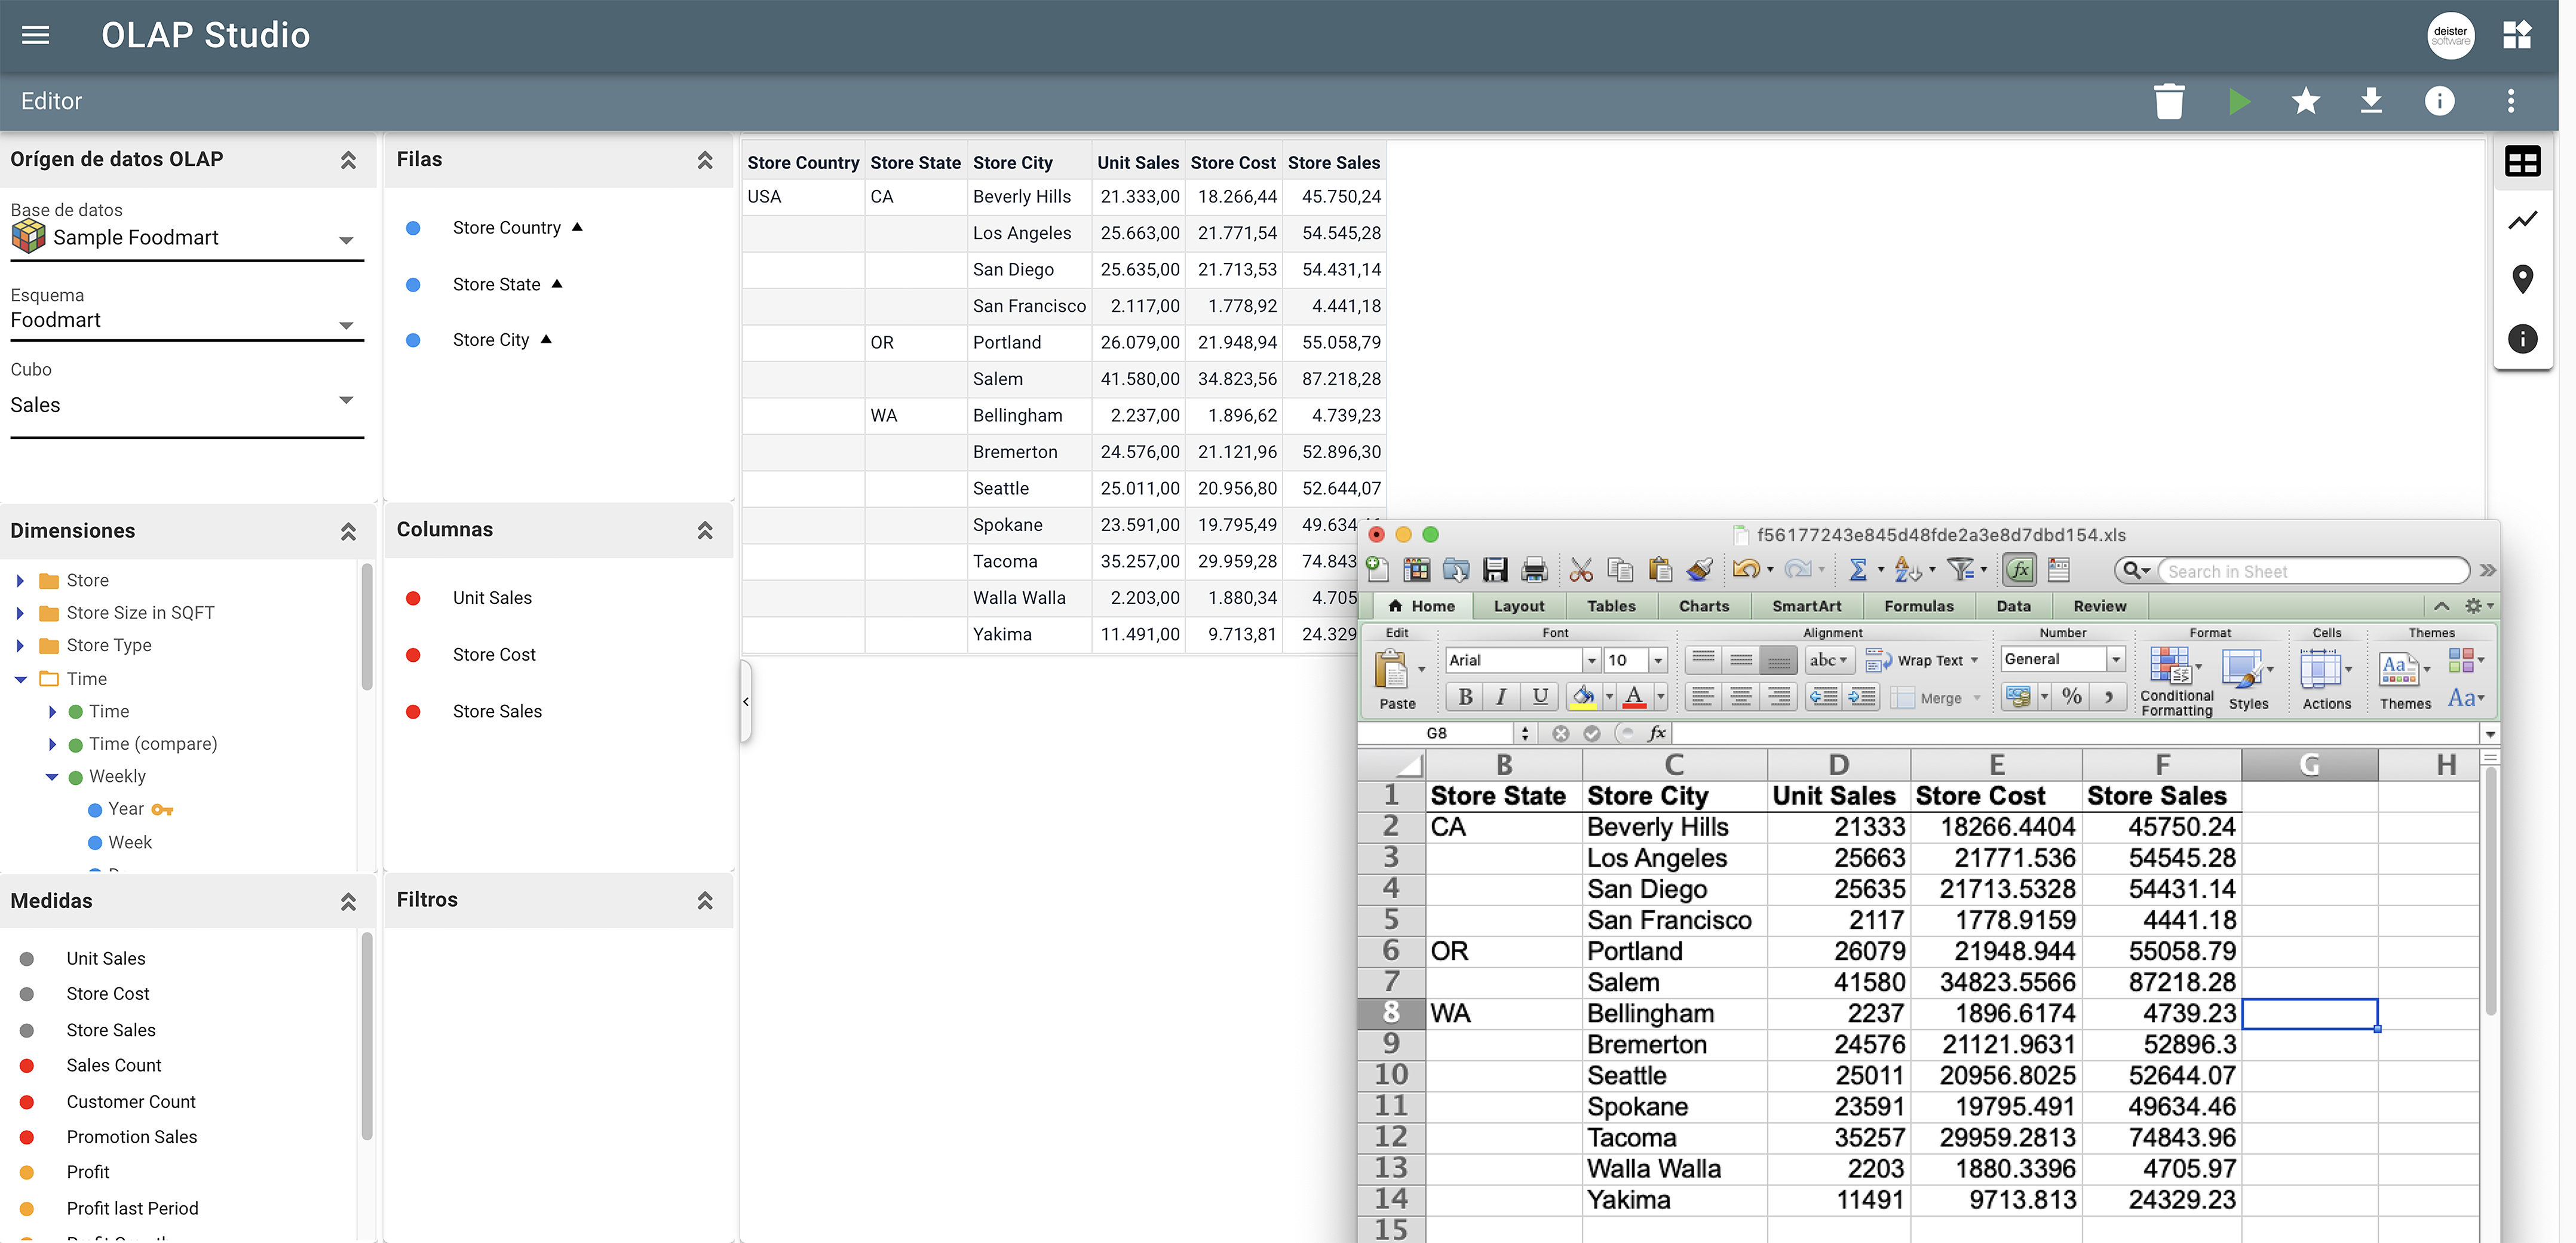
This tool supports the most popular export formats on the market such as Microsoft Excel or CSV, both for main results grids and user-requested drill-down results. It is also possible to download the information in pdf format.
For more information on which browsers are compatible with Axional OLAP, please see the Browser Compatibility table. (BCT)
Potencie su empresa hoy
Nuestro equipo está listo para ofrecerte los mejores servicios